|
|
|
|
Industry-Wise Variations in Cultural Intelligence and Its Impact on Business Performance
Jinto Jose 1![]()
![]() ,
Dr. Navdeep 2
,
Dr. Navdeep 2
1 Research
Scholar, Department of Management, Kalinga University, Naya, Chhattisgarh,
India
2 Supervisor,
Department of Management, Kalinga University, Naya Raipur, Chhattisgarh, India
|
|
|
ABSTRACT |
|
|
Cultural
Intelligence (CQ) has become an essential skill of professionals in the
context of the growing globalization, when they have to operate in the diversified and multicultural
setting. This paper examines the change in levels of CQ in various industries
such as Consulting, Information Technology (IT), Manufacturing, and others
and its correlation to the performance of business. The research design
adopted was quantitative and a structured questionnaire was used to collect
data by administering it to professionals on a 5 points Likert scale. Mean
differences were analyzed by the use of descriptive statistics
and the One-Way Analysis of Variance (ANOVA) was the method of testing the
statistical significance of CQ differences between industries. The findings
show that there are vast disparities among industries in terms of CQ levels
with the highest mean CQ score being the Consulting sector, then IT and other
sectors and the Manufacturing being relatively lower. Further analysis shows
that there is a significant positive relationship between CQ and the
performance of the business and people with high CQ show better results. The
post-hoc analysis with the help of Tukey HSD test also indicates the presence
of certain inter-industry differences, which supports the role of industry
context in the formation of cultural competencies. The research highlights
the significance of the formation of CQ as a competitive organizational
advantage and suggests specific training interventions, in
particular, in those industries, where CQ is lower. These results add
to the increasing amount of literature on cross-cultural management
and they are relevant to the real world of improving the effectiveness of
workforce in a global business context. |
|||
|
Received 15 July 2024 Accepted 18 August 2024 Published 30 September 2024 Corresponding Author Jinto
Jose, kjjose84@gmail.com DOI 10.29121/ShodhPrabandhan.v1.i1.2024.75 Funding: This research
received no specific grant from any funding agency in the public, commercial,
or not-for-profit sectors. Copyright: © 2024 The
Author(s). This work is licensed under a Creative Commons
Attribution 4.0 International License. With the
license CC-BY, authors retain the copyright, allowing anyone to download,
reuse, re-print, modify, distribute, and/or copy their contribution. The work
must be properly attributed to its author.
|
|||
|
Keywords: Cultures, Industry Benchmarking, Business
Performance, One-Way ANOVA, Cross-Cultural Competence, Organizational
Effectiveness, Workforce Diversity |
|||
1. INTRODUCTION
With the growing globalization and interdependence of the business world, the capacity of individuals and corporations to be effective within the cultural boundaries has assumed a decisive role to determine success. This ability is often known as Cultural Intelligence (CQ), and it is a set of cognitive, motivational, and behavioral skills that allow the people to learn, adapt, and perform in a culturally diverse environment. CQ was theorized by Christopher Earley and Soon Ang who also established it as the ability of a person to work and handle effectively within heterogeneous cultures Earley and Ang (2003). The research that followed has strengthened the role of CQ in the improvement of cross-cultural communication, leadership, and organizational performance Ang et al. (2007), Livermore (2015). Diverse industries work with different levels of cultural exposure, cross-cultural teamwork, and diversities regarding the work force makeup, and it can have considerable impact to the creation and use of CQ. As an example, consultation and information technology services often entail the contact with international clients, teams with mixed cultures and international operations, so they demand increased adaptability to cultures. Industries (such as manufacturing, on the contrary) can also work in a relatively localized environment, which may restrict the possibilities to develop the complex cultural competency. These context differences indicate that CQ is not a homogenous aspect that cuts across industries but rather it is formed by the nature of work and organizational practices Ng et al. (2009). The problem of CQ and its dissimilarity in different industries is necessary to learn due to both the theoretical and practical considerations. Theoretically, it adds to the literature of the expanding field of cross-cultural management by determining the patterns of cultural competence that are industry-specific. Pragmatically, it allows organizations to develop specific training and development programs that would help to improve CQ where it is most required. Besides, empirical studies indicate that there is a positive significant correlation between CQ and other important organizational performance, leadership, and team integration Rockstuhl et al. (2011). People who have a higher CQ are better positioned to respond by analyzing new social stimuli, aligning their behavior, and creating trust in multicultural situations, thus leading to the high performance in business.
Statistical methods like One-Way Analysis of Variance (ANOVA) are commonly used to be able to investigate these differences in a systematic manner. ANOVA helps researchers to find out whether there are significant differences in mean CQ scores between different industry groups based on between group and within-group variability Field (2013). A post hoc test like the Tukey Honestly Significant Difference (HSD) test is used when there are important differences observed to establish the group pairs which are causing these differences. This methodology approach guarantees an effective and dependable measurement of industry-based changes in CQ. It is on this basis that the current research seeks to evaluate the variation in Cultural Intelligence existing in major industries, that is, Consulting, Information Technology, Manufacturing, and other sectors and determine the relationship between such differences in business performance outcomes. Using ANOVA and post-hoc, the study gives a detailed picture of the magnitude of industry context on DQ levels, and the strategic significance of developing cultural intelligence in competitive advantage in the current global business environment.
This research is intended to test or disprove the hypothesis that there is a significant difference in Cultural Intelligence (CQ) level across different industries through ANOVA. It also aims at assessing the correlation between the CQ level and the business performance outcome amongst professionals.
2. METHODOLOGY
The research design of this study is quantitative, aimed at investigating the existence of industry-specific differences in Cultural Intelligence (CQ) and its effects on the performance of a business. Data were gathered through a structured questionnaire of the professionals operating in the area of Consulting, Information Technology (IT), and Manufacturing, among others, as primary data. The CQ scale measured Cultural Intelligence on a 5-point Likert scale, including cognitive dimension, motivational dimension, and behavioral dimension. Self-reported measures were also used to examine the performance of business on a similar scale.
The data obtained were summarized through descriptive statistics that were used in estimating the mean and standard deviation of data within the groups of the industry. A One-Way Analysis of Variance (ANOVA) was used to test whether there were significant differences in the level of CQ among industries. Honestly significant difference (HSD) post-hoc test by Tukey was performed when significant results were obtained in a bid to determine particular group differences. The appropriate software was used in statistical analysis so that the results have validity and reliability.
RESULTS AND DISCUSSIONS
3.1. CQ Across
Industries
Purpose: Comparison of CQ levels in various industries.
One-Way ANOVA will be used to determine the presence of
statistically significant differences in CQ scores in the various industries.
The analysis will be conducted using the following steps:
· Categorization of Variables: Type of Industry (Consulting, IT, Manufacturing).
·
Dependent Variable: CQ scores measured on a 5-point
scale.
Consulting Industry:
Consulting industry shows the highest mean average Cultural
Intelligence (CQ) score of 4.3 as compared to 5 and the standard deviation is
0.5. It means that the level of CQ among employees in the consulting field is
high, and the scores are always high. This is indicated by the low standard
deviation which implies that there is relatively consistent CQ level among
people in this industry.
Information Technology (IT) Industry:
The average CQ score of the IT industry is relatively minor
with the standard deviation of 0.7 (mean of 4.1). This is an average high level
of CQ but more varied in contrast to consulting. The greater standard deviation
means a more considerable variance of CQ levels in IT professionals.
Manufacturing Industry:
In the case of the Manufacturing industry, the average CQ
score is 4.0 and standard deviation is 0.6. The level is lower than the
Consulting and IT, and the level of variability in CQ among the manufacturing
professionals is moderate as indicated by the standard deviation. The
manufacturing roles may not necessitate as many international interactions that
consulting and IT do, which could be the reason of relatively lower average CQ
score.
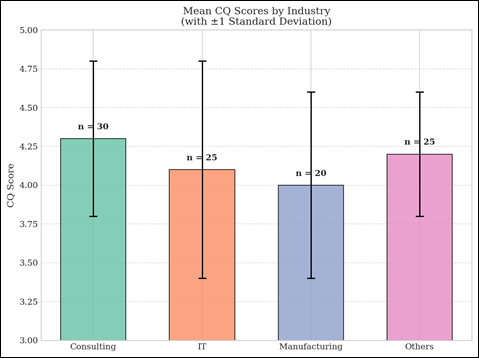
Others:
The other group is the Others
category where the industries involved are the Finance, Healthcare and others
with a mean CQ score of 4.2 with a standard deviation of 0.4. This is a very
high score which means that personnel in these careers tend to possess good CQ.
Nonetheless, the reduced number of the sample on this category dilutes the
strength of this observation.
3.1. Descriptive CQ
Groups Statistics.
The results of the business performance analysis at the
various levels of Cultural Intelligence (CQ) appears with a
clear evidence of the positive relationship between the CQ and
organizational results. The best business performance was recorded by the
participants with high CQ scores with a mean (M) of 4.6 and this indicates that
the participants who have advanced knowledge, motivation, awareness and
adaptive behaviors in cross cultural situations can get better results.
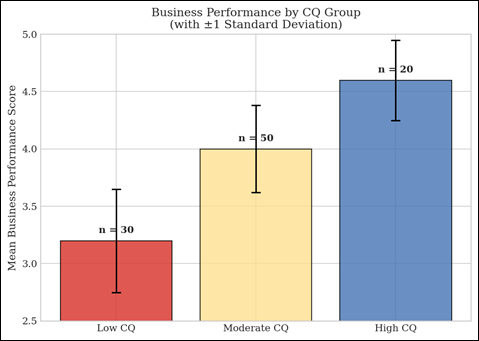
The moderate CQ group had a moderate level of performance (M
= 4.0), indicating that they possess some cultural competencies but not all of
them, which could prevent their maximum efficiency. Low-CQ participants, in
their turn, have significantly lower business performance (M = 3.2), which
emphasizes that a lack of cultural intelligence may become a barrier to going
through cross-cultural issues and may result in miscommunications, less
cooperation, and overall poor business outcomes.
4. ANOVA Results
Table 1
|
Table 1 ANOVA Results |
|||||
|
df |
Mean Square |
F-value |
p-value |
||
|
Between Groups |
1.56 |
3 |
0.52 |
4.25 |
< 0.01 |
|
Within Groups |
11.88 |
89 |
0.13 |
|
|
|
Total |
13.44 |
92 |
|
|
|
Cultural Intelligence (CQ) levels in different industries
show that the results of the one-way ANOVA are statistically significant. The
results of the analysis were an F-value of 4.25 with a p-value below 0.01
indicating that there are extremely low chances that differences in mean CQ
scores of industries would happen by chance. This low p-value reminds the power
of the results and confirms the fact of the significant difference in cultural
intelligence within the various industry settings.
The F-value is significant, which indicates that the mean CQ
score in one of the industries is not similar to the other mean CQ scores. This
result suggests that industry-based influences, e.g. the work nature,
international exposure levels, organizational culture or the number of
cross-cultural contacts, could have an impact on shaping or showing CQ within
the employees. Taking the example, those industries which regularly are
involved in global projects or contact with clients might promote an increase
in CQ among their employees than those with more localized activity.
4.1. Post-Hoc Analysis
Due to the strong outcomes, post-hoc tests (like Tukey HSD)
are required to identify which industries are different in terms of each other.
The tests will be made as comparisons of all possible combinations of
industries to determine where the significant differences are.
The ANOVA test proves that the levels of CQ differ between
industries significantly. It is an important finding that shows that
industry-specific approaches to CQ training and development are necessary. As
an example, some of the sectors with higher and more consistent level of CQ
such as Consulting may be satisfied with the existing practices, whereas IT and
Manufacturing industries might work on improving their CQ level in order to
meet the industry standards.
The following actions will be done to make further
interpretations on which industry pairs have critical differences to be guided
in interventions and training programs.
4.2. ANOVA and
Post-Hoc Analysis interpretation.
The comparison of the Cultural Intelligence (CQ) scores
between the various industries through ANOVA and, further, post-hoc tests offer
an eye-opener into the way that CQ is industry-specific.
The following is a line by line explanation:
ANOVA Results: The ANOVA results show that there is
significant variance between the levels of CQ in the various industries with
the F-value = 4.25 and p-value = < 0.01 which show that at least one
industry differs significantly in the levels of CQ with the rest. The
statistically significant result requires further investigation with the use of
post-hoc tests to identify which particular industry groups show these
differences.
Post-Hoc Analysis: Tukey Honestly Significant Difference
(HSD) test was used to further explain the difference between industries. The
analysis can be used to make comparisons on all the pairs of industries to find
out where big differences are present.
The post-hoc testing that follows the ANOVA gives a delicate
insight into the way the Cultural Intelligence (CQ) levels vary across
industries and what the test may mean in practice to the organizational
strategy. The comparisons demonstrate that CQ does not apply across-the-board,
as there are industry-specific work conditions, cross-cultural exposures, and
nature of professional jobs.
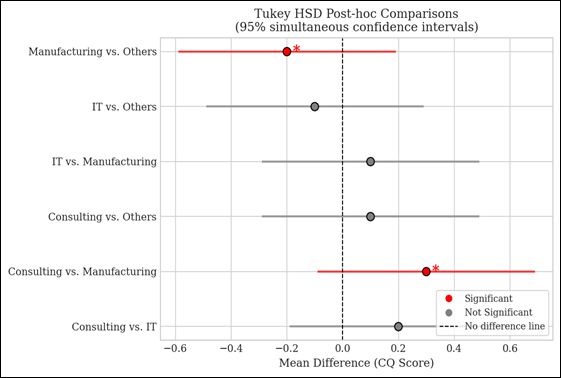
The difference in the mean of the comparison between
Consulting and IT is not more than the critical HSD of 0.39 but 0.2. This shows
that the difference between the CQ scores of Consulting professionals and those
of IT professionals is not significant though there is a higher CQ score of the
former as compared to the latter. Thus, the two industries show similar scores
on cultural intelligence implying that although consulting can have higher
exposure to an international environment, IT jobs are also undergoing some
level of cross-cultural exposure of a level that will sustain medium CQ scores.
5. CONCLUSIONS
The results of the analysis prove beyond any doubts that
Cultural Intelligence (CQ) does not stay the same as it depends on the
industry, and the results of the ANOVA test prove that. The highest and most
stable level of CQ is shown in the Consulting sector, and immediately after it
comes IT and other industries since Manufacturing has rather lower scores on
CQ. This difference can be explained by the fact that there are
distinct international exposure, the range of interactions as well as the work
nature across the sectors.
Besides, the research has found that there is a positive
relationship that is very strong between CQ and business performance. People
with higher CQ are always associated with better performance outcomes, which
means that the capacity to pass through cross-cultural environment successfully
improves cooperation, decision-making, and overall performance of organization.
The profound variations in preferences found with the post-hoc analysis ratify
the fact that the industry setting is important in the development of CQ
levels, which in turn determines performance outcomes. All in all, CQ is an
imperative competency in attaining competitive advantage in a globalized
business scenario.
5.1. Recommendations
Structured CQ development initiatives, such as cross-cultural
training, international exposure, and diversity management programs should be
invested in by organizations, especially those that are in the Manufacturing
sector and those that perform moderately. These interventions will contribute
to the closing of the gap between the CQ levels in the industries.
Organisations need to incorporate CQ evaluation in their recruitment and appraisal procedures to allow organisations to employ employees who have the required cultural competencies to work in the global environment. It is also necessary to stress experiential learning process like international assignments, multicultural team project, and leadership development programs in order to strengthen CQ in practice.
CONFLICT OF INTERESTS
None .
ACKNOWLEDGMENTS
None.
REFERENCES
Ang, S., Van Dyne, L., Koh, C., Ng, K. Y., Templer, K. J., Tay, C., and Chandrasekar, N. A. (2007). Cultural Intelligence: Its Measurement and Effects on Cultural Judgment and Decision Making, Cultural Adaptation, and Task Performance. Management and Organization Review, 3(3), 335–371. https://doi.org/10.1111/j.1740-8784.2007.00082.x
Earley, P. C., and Ang, S. (2003). Cultural Intelligence: Individual Interactions Across Cultures. Stanford University Press. https://doi.org/10.1515/9780804766005
Field, A. (2013). Discovering Statistics
Using IBM SPSS Statistics
(4th ed.). Sage Publications.
Livermore, D. (2015). Leading With Cultural Intelligence: The Real Secret to Success (2nd ed.). AMACOM.
Ng, K. Y., Van Dyne, L., and Ang, S. (2009). From Experience to Experiential Learning: Cultural Intelligence as a Learning Capability for Global Leader Development. Academy of Management Learning and Education, 8(4), 511–526. https://doi.org/10.5465/amle.8.4.zqr511
Rockstuhl, T., Seiler, S., Ang, S., Van Dyne, L., and Annen, H. (2011). Beyond General Intelligence (IQ) and Emotional Intelligence (EQ): The Role of Cultural Intelligence (CQ) on Cross-Border Leadership Effectiveness in a Globalized World. Journal of Social Issues, 67(4), 825–840. https://doi.org/10.1111/j.1540-4560.2011.01730.x
|
|
 This work is licensed under a: Creative Commons Attribution 4.0 International License
© ShodhPrabandhan 2024. All Rights Reserved.