|
|
|
|
Original Article
PREFERENCE FOR ONLINE CLASSES DURING THE COVID-19 PANDEMIC: A ‘D-NEEDS’ HIERARCHICAL APPROACH AMONG POSTGRADUATE STUDENTS
|
Bijith
Vakkalary 1* 1 Assistant Professor, PG
Department of Journalism and Communication, Dwaraka Doss Goverdhan Doss
Vaishnav College (Autonomous), Arumbakkam, Chennai-600106, India 2 Assistant Professor and Head, PG Department
of Journalism and Communication, Dwaraka Doss Goverdhan Doss Vaishnav
College (Autonomous), Arumbakkam, Chennai-600106, India |
|
|
|
ABSTRACT |
||
|
The Covid-19 pandemic affects all over the world and it disrupted the human life. The educational sector is one of the most affected sectors due to the Covid-19 pandemic. Educational institutes are shut down due to the lockdown and the classes are shifted to online mode. But there are some irregularities noticed in students attending online classes. Thus, the reason behind the study is to discover the deficiency needs of the students and their preference towards the acceptance of online classes during the Covid-19 pandemic. The findings reveal that the students have an unfavourable attitude the towards the online classes. This particular research was perpetrated on 100 postgraduate students in Kerala and Tamil Nadu to analyse their preference for online classes. Primary data collected through a questionnaire. Research question and hypothesis were tested with statistical tools. Keywords: D-needs, ICT, Technology,
Comfortability, Support, E learning, Accessibility. |
||
INTRODUCTION
The impact of the
Covid-19 pandemic affects everywhere the globe. It disrupted human life in
every sector around the world. Lockdown compelled the people to maintain social
distancing as the first prevention step from Covid-19. People are forced to
avoid social gatherings and it completely affects normal life. The pandemic
also disrupted the educational sector in many ways. The government systems are
taken the action to limit social contact for reducing the spread of the
Coronavirus. Educational institutes are shut down due to lockdown. The offline
regular classes are suspended and the examinations were postponed. Unstructured
schedules and uncertainty in a new situation compelled to seek an alternative
option to continue the functioning of educational institutions. Universities
and schools are opted for the web mode of classes to beat the uncertainty of
the Covid19 pandemic. As per the expansion of the Covid19 Situation the
requirement of online classes is additionally increased. the traditional model of
face-to-face classes is replaced by online classes. As a result, Covid19
Pandemic compelled the students to shift to online mode of learning.
The pandemic
situation results in the collapse within the academic calendar and makes some
uncertainty within the smooth completion of the courses. New semester classes
are started lately online. Initially, teachers and students were a bit confused
with the newly adapted mode. Besides slowly people were trying to regulate to
the conditions. The face-to-face offline classes in campus atmosphere with
friends and teachers replaced by online classes. Which is widely used the
chances of online social networking sites and other online platforms. The
Lectures are converted to ppts and books are replaced by Pdf. Covid19 Pandemic
worked as a catalyst for online educational platforms. the academic activities
like presentations, assignments, projects, examinations. Etc are conducted and
submitted via the net. Online education is introduced to boost the pliability
and convenient mode of education, but the sudden compelled shift makes some
students have a negative approach towards online classes.
Moreover, a surge
in Covid-19 has resulted in online classes become a part of reality thus
increasing its relevance. The situation makes the life of students more
uncertain. Students are faced with many social, psychological, emotional, and
technological challenges during this period. The current study approaches the
deficiency needs of post-graduate students during the Covid-19 Pandemic and
their preference towards the acceptance of online classes in terms of
Technology, Comfortability, and also the support.
Review of literature
Van et al. (2020) Conduct a study on students’ perception of
online classes with the hierarchy of factors. The seven factors Basic online
modality, Teaching presence, Instructional support, cognitive presence,
Interactive online modality, social online comfort, and social presence that
are reliable, coherent, and significant under different conditions.
Instructional support is the perception of students towards the input,
rehearsal, feedback, evaluation from the side of instructor. Quality of
communication in lectures, directions, encouragement, and individual feedback
is referred to as Texting presence. Competent use of basic online tools,
navigation methods, online grid book, and online grading comes under online
modality. Social presence is the interaction between the students. The ability
of the instructor to provide a comfortable environment is called online social
comfort. Cognitive presence is the critical and deep understanding of materials
from a different perspective. The interactivity in an online class is referred
to as Interactive Online Modality. Students prefer traditional mode study due
to learning style preference and poor past experience. There is an adverse
attitude in students against online classes because they experience a shoddy
basic functional competence, Poor instructional design, sporadic teaching
presence, and poorly implemented cognitive and social aspects.
Kulal
and Nayak (2020). Conducted a study on perception of teachers
and students toward online classes in Dakshina Kannada and Udupi District. They
used a descriptive quantitative research design. Undergraduate, postgraduate,
and college teachers are the respondents of this study. According to the study,
students are getting enough support from teachers. Lack of training for
teachers to conduct online classes and technical issues are the major barriers
of online classes. In this study, the opinion of the student towards online classes
is explained based on the impact, Comfortability, and support of Teachers in
online classes. This research concluded that both students and teachers have an
optimistic view of online classes. E-learning contains a more significant role
to play in the future but it cannot be the replacement to traditional classes.
This study tries to grasp the obstacles of online learning and take corrective
measures to overcome them.
Lederer
et al. (2020) Conduct a study on the unique needs of U.S.
College students during the Covid-19 Pandemic. They consider the mental health
concern and academic success of the students. They also give attention to the
hearings and food insecurities, financial problems, lack of socializing and
sense of belongingness, improper accessibility, and uncertainty about the
future. This research recommends more clarity communication, prioritize student
support services and use employ equitable system in the education sector. The
authors mentioned about the social and emotional issues faced by students. In
this research, the students from the LGBT community and their needs during a
pandemic are also mentioned.
Perception of
equivalence between online and face-to-face academic activities by
undergraduate medical students during the Covid-19 Pandemic Hundekari
et al. (2020). They conduct an observational study and
understand that students have a negative perception of online learning.
Students more prefer face-to-face classes to online classes due to better
interactive platforms. Even though online classes help the students to gain
knowledge and engage them in studying to some extent. But students aren't much
comfortable in online classes when compares to face-to-face classes.
According to Kundu
and Nath (2018). The long run development in ICT-based
education depends on the speed of broadband, availability of devices,
improvement in infrastructure, and government initiatives. They find out web
mode of education would be increased collaboration between learners in all
segment. Barriers to utilizing ICT in education in India with a special focus
on rural areas suggest developing more infrastructure and facilities for
ICT-based education.
Larreamendy-Joerns
and Leinhardt (2006), mentioned the shift from an offline mode of learning to online mode
learning as "online class is an optional" to "online class is
necessary". This study determines the gaining of the importance of online
mode of learning. According to Lee and Rha (2009), Institutional support is an important
element of presence of teaching presence. This study emphasis on structured
interactions which enhance the flexibility of understanding.
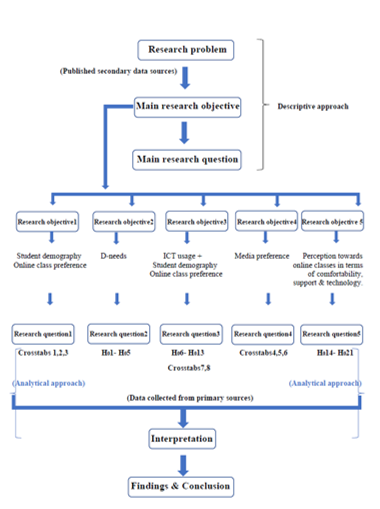
Research methodology
The present
research paper is a quantitative study and it is based on primary data. This
study utilized a Descriptive- Analytical research design by using survey
method. It includes collecting data, modelling, analysing the data and
evaluating the results. Purposive sampling under the Non-probability sampling
method is used for this study. The sample was collected from postgraduate
students of Kerala and Tamil Nadu. They are coming under the streams of Arts
and Science. The population also diversified in demographic profiles like age,
gender, stream of study, nativity, and monthly family income. In total 157
response are collected and filtered them into 100 samples due to incomplete or
redundant responses.
Conceptual Framework
|
Figure 1
|
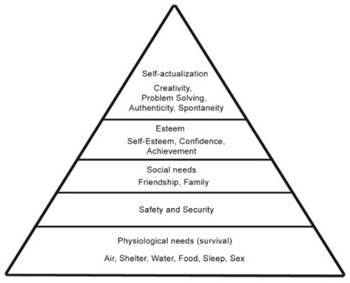
Maslow's hierarchy of needs theory
The theory was
proposed by Abraham Harold Maslow in his paper "A theory of Human
motivation" on 1943. Maslow divides the human needs into five hierarchical
levels within a pyramid and arranged them from bottom to top.
|
Figure 2
|
In this study tries to understand the
‘d-needs’ of postgraduate students and their perception towards acceptance of
online classes. Proper housing facilities and adequate food to eat at home come
under the physiological needs. Financial support from safety needs. family
atmosphere, and loneliness feelings from social needs (love and belongingness
need). Education is connected with all five needs in levels of hierarchy.
Data analysis and interpretation
Table 1
|
Table 1 Cross Tabulation Between
Gender of the Respondents and Acceptance of Online Classes |
|||
|
Gender of the respondents |
Acceptance of online classes. |
Total |
|
|
|
Yes |
No |
|
|
Female |
11 |
39 |
50 |
|
Male |
9 |
41 |
50 |
|
Total |
20 |
80 |
100 |
Out of 100
respondents, 80% have an unfavourable attitude towards the acceptance of online
classes. The male and female respondents are equally distributed. Out of 50
female respondents, 39 are not preferred online classes. That is 78% of the
female respondents. Out of 50 male respondents, 41 are not preferred online
classes. That is 82% of the male respondents.
Only 20% of the total respondents have a Favourable attitude towards the
acceptance of online classes. The above table reveals that when compares to
female respondents, male respondents are a slightly more unfavourable attitude
towards acceptance of online classes.
Table 2
|
Table 2 Cross Tabulation Between
Gender of the Respondent and Media Preference for Online Classes |
||||
|
Gender of the respondents |
Media preference for online classes |
Total |
||
|
|
Laptop |
Mobile |
Personal computer |
|
|
Female |
7 |
42 |
1 |
50 |
|
Male |
13 |
36 |
1 |
50 |
|
Total |
20 |
78 |
2 |
100 |
The male and
female respondents are 50 in number and they are equally distributed. Out of 50
female respondents, 7 are using laptops, 42 are using Mobile phones, and only
one using a personal computer for attending online classes. 84% of the female
respondents are chosen mobile phones for attending online classes. Out of 50
male respondents, 13 are using laptops, 36 are using Mobile phones, and only
one using a personal computer for attending online classes. 72% of the male
respondents are chosen mobile phones for attending online classes. 14% of the
female respondents and 26% of male respondents are chosen laptops for attending
online classes. That means male respondents are more preferred laptops for
online classes than female respondents.
When compare the
female and male respondents, they have shown a 12% difference in mobile phone
preference for attending online classes. That means female respondents are more
preferred mobile phones for attending online classes than male respondents. Out
of 100 respondents, 78% are preferred mobile phones for attending online
classes.
The above table
reveals that mobile phones are the most preferred medium for attending online
classes.
Table 3
|
Table 3 Cross Tabulation between
Acceptance of Online Classes and their ICT usage Parameters |
|||||||
|
Acceptance of online classes |
Length of internet usage |
Frequency of internet usage |
Average Normal hours spent at online |
Total |
|||
|
Less than 1/3hrs |
1-2 hrs |
3-4 hrs |
More than 4 hrs |
||||
|
From last 1year |
Every day |
0 |
1 |
0 |
0 |
1 |
|
|
Last 2years |
Every day |
0 |
1 |
0 |
1 |
||
|
3-5times |
0 |
0 |
1 |
1 |
|||
|
Last 3years |
Every day |
1 |
1 |
2 |
4 |
8 |
|
|
Yes |
3-5times |
0 |
0 |
1 |
0 |
1 |
|
|
More than 5years |
Every day |
0 |
1 |
3 |
4 |
8 |
|
|
From last 1year |
Every day |
0 |
0 |
1 |
0 |
1 |
|
|
Last 2years |
Every day |
1 |
2 |
2 |
1 |
6 |
|
|
3-5times |
0 |
1 |
2 |
0 |
3 |
||
|
No |
Last 3years |
Every day |
1 |
6 |
5 |
7 |
19 |
|
3-5times |
0 |
1 |
1 |
0 |
2 |
||
|
More than 5years |
Every day |
0 |
4 |
20 |
24 |
48 |
|
|
3-5times |
1 |
0 |
0 |
0 |
1 |
||
|
Total |
4 |
18 |
37 |
41 |
100 |
||
Out of 100
respondents, 80 have an unfavourable attitude towards the acceptance of online
classes. There are 74 respondents who are everyday internet users from this
category. 49 are using the internet for more than the last 5 years and 21 are
using the internet for the last 3 years. 32 respondents are spent an average
normal time per day more than 4 hours and 31 are spent 3-4 hours. There are 20
respondents who have favourable attitude towards acceptance of online classes.
Out of them, 18 are everyday users. 8 are using the internet for more than the
last 5 years and 9 are using the internet from the last 3 years. 9 respondents
are spent an average normal time per day more than 4 hours and 6 are spent 3-4
hours. The above table reveals that from the category of respondents who have
unfavourable attitudes towards online classes, 92% are everyday internet users.
Table 4
|
Table 4 McNemar’s Test for
Dichotomous Categorical Association between Respondents “Proper housing
facilities” and “Adequate food to eat at home |
||||
|
Proper housing facilities |
Adequate food to eat at home |
Total |
Significant value |
|
|
|
Yes |
No |
|
|
|
Yes |
96 |
1 |
97 |
|
|
No |
3 |
0 |
3 |
0.625 |
|
Total |
99 |
1 |
100 |
|
|
Not significant at 0.05 level (p = 0.625 > 0.05) |
||||
Hence the null
hypothesis, “Ho1: Respondents “Proper housing facilities” will have no
significant association with “adequate food to eat at home”” is accepted. That
means there is no significant association between respondents “Proper housing
facilities” and “adequate food to eat at home”. From the above table 97% of the
total respondents have proper housing facilities and 99% of the respondents
have adequate food to eat at home. Out of 100 respondents, only one of the
respondents has not adequate food to eat at home.
Table 5
|
Table 5 Mcnemar’s Test for
Dichotomous Categorical Association Between Respondents “Adequate Food to Eat
at Home” and “Pleasant Family Atmosphere |
||||
|
Adequate food to eat at home |
Pleasant family atmosphere |
|
Total |
Significant value |
|
|
Yes |
No |
|
|
|
Yes |
90 |
9 |
99 |
|
|
No |
0 |
1 |
1 |
0.004 |
|
Total |
90 |
10 |
100 |
|
|
Significant at 0.01 level (p = 0.004 < 0.05) |
||||
Hence the null
hypothesis, “Ho2: Respondents “Adequate food to eat at home” will have no
significant association with “Pleasant family atmosphere”” is rejected. That
means Respondents “Adequate food to eat at home” have significant association
with “Pleasant family atmosphere”. From the above table, it is clear that out
of 100 respondents 90 have a pleasant family atmosphere. When the family
atmosphere is not pleasant it will affect the physiological needs of the
respondents. Here majority have a pleasant family atmosphere. So, the basic
physiological needs are met.
Table 6
|
Table 6 McNemar’s test for dichotomous categorical
association between respondents “Pleasant family atmosphere” and “Feel
loneliness in house |
||||
|
Pleasant family atmosphere |
Feel loneliness in house |
Total |
Significant value |
|
|
|
Yes |
No |
|
|
|
Yes |
11 |
79 |
90 |
|
|
No |
9 |
1 |
10 |
0 |
|
Total |
20 |
80 |
100 |
|
|
Significant at
0.01 level (p = 0.000 < 0.05) |
||||
Hence the null
hypothesis, “Ho3: Respondents “Pleasant family atmosphere” will have no
significant association with “Feel loneliness in house”” is rejected. That
means Respondents “Pleasant family atmosphere” have significant association
with “Feel loneliness in house”. The majority of the respondents have a
pleasant family atmosphere and they do not feel lonely at home.
Table 7
|
Table 7 McNemar’s test for
Dichotomous Categorical association between Respondents “Feel loneliness in
house” and “Proper financial support |
||||
|
Feel loneliness in house |
Proper financial support |
Total |
Significant value |
|
|
|
Yes |
No |
|
|
|
Yes |
13 |
7 |
20 |
|
|
No |
77 |
3 |
80 |
0 |
|
Total |
90 |
10 |
100 |
|
|
Significant at
0.01 level (p = 0.000 < 0.05) |
||||
Hence the null
hypothesis, “Ho4: Respondents “Feel loneliness in house” will have no
significant association with “Proper financial support”” is rejected. That
means there is a significant association between Respondents “Feel loneliness
in house” and “Proper financial support”. The majority of the respondents have
proper financial support and they do not feel lonely in house.
Table 8
|
Table 8 Mcnemar’s Test for Dichotomous Categorical Association
Between Respondents “Proper Financial Support” and “Proper Housing Facilities |
||||
|
Proper financial support |
Proper housing facilities |
Total |
Significant value |
|
|
|
Yes |
No |
|
|
|
Yes |
89 |
1 |
90 |
|
|
No |
8 |
2 |
10 |
0.039 |
|
Total |
97 |
3 |
100 |
|
Significant at
0.01 level (p = 0.000 < 0.05) Hence the null hypothesis, “Ho5: Respondents
“Proper financial support” will have no significant association with “Proper
housing facilities”” is rejected. That means there is a significant association
between Respondents “Proper financial support” and “Proper housing facilities”.
Out of 100 respondents 97% have proper housing facilities and 90% have proper
financial support.
Table 9
|
Table 9 One-way ANOVA Test for the Influence of Age of the Respondents on their
Length of Internet usage |
|||||
|
Length of Internet usage |
Sum of Squares |
Degrees of freedom |
Mean Square |
F ratio |
Significant value |
|
Between Groups |
2.315 |
3 |
0.772 |
1.322 |
0.272 |
|
Within Groups |
56.045 |
96 |
0.584 |
|
|
|
Total |
58.36 |
99 |
|||
The "F"
ratio (1.322) for the influence of age of the respondents on their length of
internet usage are not significant at 0.05 level (p = 0.272). Hence the null
hypothesis, “Ho8: There will be no significant difference among age of the
respondents and their length of internet usage” is accepted. It means Age of
the respondents does not have any effect on their length of internet usage. So,
there is no significant difference among age of the respondents and their
length of internet usage.
Table 10
|
Table 10 Chi-Square Test for
Association Between Gender of the Respondents and their Length of Internet
Usage |
||||||||
|
Gender of the respondent |
Length of Internet usage |
Total |
Pearson Chi-Square |
|||||
|
From last 1year |
Last 2years |
Last 3years |
More than 5years |
Chi-Square Value |
df |
Significant value |
||
|
Female |
2 |
9 |
18 |
21 |
50 |
|||
|
Male |
0 |
2 |
12 |
36 |
50 |
11.602 |
3 |
0.009 |
|
Total |
2 |
11 |
30 |
57 |
100 |
|||
|
Chi-Square Value: 11.602 Significant at 0.009 level (p < 0.01) |
||||||||
Hence the null
hypothesis, “Ho12: There will be no significant association between gender of
the respondents and their length of internet usage” is rejected. That means
there is a significant association between gender of the respondents and their
length of internet usage. The length of internet usage is more among male
respondents than female respondents.
Table 11
|
Table 11 Chi-Square Test for
Association Between Female and Male Respondents in their Agreement Towards “I
Receive Enough Support and Resources from My Teacher |
||||||||
|
Gender of the respondents |
I receive enough support and resources from my
teacher |
Total |
Pearson Chi-Square |
|||||
|
Strongly Disagree |
Disagree |
Agree |
Strongly Agree |
Chi-Square Value |
df |
Sig. |
||
|
Female |
0 |
6 |
30 |
14 |
50 |
|||
|
Male |
1 |
15 |
29 |
5 |
50 |
9.137 |
3 |
0.028 |
|
Total |
1 |
21 |
59 |
19 |
100 |
|||
|
Chi-Square Value: 9.137 Significant at 0.028 level (p < 0.05) |
||||||||
Hence the null
hypothesis, “Ho14: There will be no significant association between female and
male respondents in their agreement towards “I receive enough support and
resources from my teacher”” is rejected. That means there is a significant
association between gender of the respondents and their agreement towards “I
receive enough support and resources from my teacher”. Both male and female
respondents differ in their perception towards receiving support and resources
from teachers during Online classes. Female respondents differ in their
attitude towards receiving support and resources from teachers during the
online classes. Female respondents are more favourable than male respondents
towards the resource provisions during the online classes.
Table 12
|
Table 12 Chi-Square Test for
Association Between Arts and Science Students in their Agreement Towards “I
Abide by Guidelines for Effective Communication and Interaction in an Online
Class Set by Teachers |
||||||||
|
Stream of study of the respondents |
I abide by guidelines for effective communication and
interaction in an online class set by teachers. |
Total |
Pearson Chi-Square |
|||||
|
Strongly Disagree |
Disagree |
Agree |
Strongly Agree |
Chi-Square Value |
df |
Sig. |
||
|
Arts |
4 |
12 |
20 |
14 |
50 |
|||
|
Science |
5 |
16 |
26 |
3 |
50 |
8.583 |
3 |
0.035 |
|
Total |
9 |
28 |
46 |
17 |
100 |
|||
|
Chi-Square
Value: 8.583 Significant at
0.035 level (p < 0.05) |
||||||||
Hence the null
hypothesis, “Ho15: There will be no significant association between arts and
science students in their agreement towards “I abide by guidelines for
effective communication and interaction in an online class set by teachers”” is
rejected. That means there is a significant association between Stream of study
of the respondents and their agreement towards “I abide by guidelines for
effective communication and interaction in an online class set by teachers”.
Both arts and science students significantly differ in their attitude towards
complains with guidelines. Arts students more favourable than science students
towards guidelines during the online classes.
Table 13
|
Table 13 Chi-Square Test for
Association Between Arts and Science Students in their Agreement Towards “My
Academic Performance has Improved Due to Online Tutorials |
||||||||
|
Stream of study of the respondents |
My academic performance has improved due to
online tutorials. |
Total |
Pearson Chi-Square |
|||||
|
Strongly Agree |
Agree |
Disagree |
Strongly disagree |
Chi-Square Value |
df |
Sig. |
||
|
Arts |
5 |
16 |
20 |
9 |
50 |
|||
|
Science |
0 |
10 |
26 |
14 |
50 |
8.254 |
3 |
0.041 |
|
Total |
5 |
26 |
46 |
23 |
100 |
|||
|
Chi-Square Value: 8.254 Significant at 0.041 level (p < 0.05) |
||||||||
Hence the null
hypothesis, “Ho16: There will be no significant association between arts and
science students in their agreement towards “My academic performance has
improved due to online tutorials”” is rejected. That means there is a
significant association between Stream of study of the respondents and their
agreement towards “My academic performance has improved due to online
tutorials”. Both arts and science students significantly differ in their
attitude towards improvement in academic performance due to online tutorials.
Students from science stream have an unfavourable attitude than arts students
towards the improvement in academic performance due to online tutorials.
Table 14
|
Table 14 Chi-Square Test for
Association Between Arts and Science Students in their Agreement Towards
“Network Connectivity Never Interferes with Online Classes |
||||||||
|
Stream of study of the respondents |
Network connectivity never interferes with online
classes. |
Total |
Pearson Chi-Square |
|||||
|
Strongly Agree |
Agree |
Disagree |
Strongly disagree |
Chi-Square Value |
df |
Sig. |
||
|
Arts |
10 |
14 |
24 |
2 |
50 |
|||
|
Science |
5 |
15 |
17 |
13 |
50 |
10.963 |
3 |
0.012 |
|
Total |
15 |
29 |
41 |
15 |
100 |
|||
|
Chi-Square
Value: 10.963 Significant at
0.012 level (p < 0.05) |
||||||||
Hence the null
hypothesis, “Ho17: There will be no significant association between arts and
science students in their agreement towards “Network connectivity never
interferes with online classes”” is rejected. That means there is a significant
association between Stream of study of the respondents and their agreement
towards “Network connectivity never interferes with online classes”.
The students from
arts and science stream significantly differ in their attitude towards
interfere of network connectivity during online classes. Students from science
stream have more disagreement regarding non-interference of network
connectivity with online classes.
Table 15
|
Table 15 Chi-Square Test for
Association Between Kerala and Tamil Nadu Students in their Agreement Towards
“I have Adequate Infrastructure such as Smartphone, Personal Computer,
Internet Connection to Access Online Classes |
|||||||
|
Nativity of the respondents |
I have adequate infrastructure such as
smartphone, Personal computer, internet connection to access online classes |
Total |
Pearson Chi-Square |
||||
|
Disagree |
Agree |
Strongly Agree |
Chi-Square Value |
df |
Sig. |
||
|
Kerala |
1 |
30 |
26 |
57 |
|||
|
Tamil Nadu |
7 |
26 |
10 |
43 |
10.135 |
2 |
0.006 |
|
Total |
8 |
56 |
36 |
100 |
|||
|
Chi-Square Value: 10.135 Significant at 0.006 level (p < 0.01) |
|||||||
Hence the null
hypothesis, “Ho18: There will be no significant association between Kerala and
Tamil Nadu students in their agreement towards “I have adequate infrastructure
such as smartphone, Personal computer, internet connection to access online
classes”” is rejected. That means there is a significant association between
Nativity of the respondents and their agreement towards “I have adequate
infrastructure such as smartphone, Personal computer, internet connection to
access online classes”. The postgraduate students from Kerala and Tamil Nadu,
significantly differ in their attitude towards infrastructure support for
online classes. Students from Kerala show a more favourable attitude towards
having adequate infrastructure facilities than students from Tamil Nadu.
Findings AND discussion
·
Majority
of the respondents have an unfavourable attitude towards the acceptance of
online classes.
·
Male
respondents are a slightly more unfavourable attitude towards acceptance of
online classes than female respondents.
·
Mobile
phones are the most preferred medium for attending online classes.
·
Female
respondents are more preferred mobile phones for attending online classes than
male respondents.
·
Majority
of the respondents are everyday internet users.
·
The
internet usage on male respondents is slightly more than female respondents.
·
Most of
the respondents who have unfavourable attitudes towards online classes, are
everyday internet users.
·
Most of
the respondents have proper housing facilities.
·
Most of
the respondents have adequate food to eat at home.
·
Most of
the respondents have pleasant family atmosphere.
·
Majority
of the respondents do not feel lonely at home.
·
Most of
the respondents have proper financial support.
·
Length
of internet usage is more among male respondents than female respondents.
·
Gender
of the respondent has no significant influence of their attitude towards
Comfortability.
·
Female
students are more favourable than male students towards the resource provisions
during the online classes.
·
Gender
of the respondent has no significant influence of their attitude towards
Technology.
·
Respondents
stream of study has no significant influence of their attitude towards
Comfortability.
Conclusion
The Covid-19
Pandemic has an impact on all the sectors in the world including the education
sector. The crisis stretches longer and the educational institutions are
compelled to follow the guidelines to minimize the crisis risk. The result of
this study indicates that there is an unfavourable attitude towards online
classes among postgraduate students. Web-oriented learning methods can still
exist as an additional method instead of replacing traditional face-to-face
learning. The reasons behind this adverse perception among students are less
effectiveness, unsatisfied learning environment, network interferences, less
understandability, less interaction, etc.
Constantly valued
new instructive techniques and better network connectivity furnish the attitude
of students towards online classes. Instead of replacing the traditional mode
of face-to-face learning, online learning must be wanted to become an additional
method of learning. There is a need to understand the barriers that come in the
way of acceptance of online classes and take remedial measures to overcome
them.
ACKNOWLEDGMENTS
None.
REFERENCES
Hundekari, J., Mittal, R., Wasnika, S., and Kot, L. (2020). Perception of Equivalence Between Online and Face-To-Face Academic Activities by Undergraduate Medical Students During COVID-19 Pandemic. International Journal of Scientific Research in Dental and Medical Sciences, 2(4), 115–120. https://doi.org/10.30485/ijsrdms.2020.253310.1091
Kulal, A., and Nayak, A. (2020). A Study on Perception of Teachers and Students Toward Online Classes in Dakshina Kannada and Udupi District. Asian Association of Open Universities Journal, 15(3). https://doi.org/10.1108/AAOUJ-07-2020-0047
Kundu, A., and Nath, D. K. (2018). Barriers to Utilizing ICT in Education in India with a Special Focus on Rural Areas. International Journal of Scientific Research and Reviews, 7(2), 341–359. https://doi.org/10.13140/RG.2.2.14437.73449
Larreamendy-Joerns, J., and Leinhardt, G. (2006). Going the Distance with Online Education. Review of Educational Research, 76, 567–605.
Lederer, A. M., Hoban, M. T., Lipson, S. K., Zhou, S., and Eisenberg, D. (2020). More than Inconvenienced: The Unique Needs of U.S. College Students During the COVID-19 Pandemic. Health Education & Behavior, 48(1), 14–19. https://doi.org/10.1177/1090198120969372
Lee, H.-J., and Rha, I. (2009). Influence of Structure and Interaction on Student Achievement and Satisfaction in Web-Based Distance Learning. Educational Technology & Society, 12(4), 372–382.
Maslow, A. H. (1943). A Theory of Human Motivation. Psychological Review, 50(4), 370–396. https://doi.org/10.1037/h0054346
National Council for the Social Studies. (n.d.). Wilcoxon Signed-Rank Tests: Procedures and guidelines. https://ncss-wpengine.netdna-ssl.com/wp-content/themes/ncss/pdf/Procedures/PASS/Wilcoxon_Signed-Rank_Tests.pdf
Van Wart, M., Ni, A., Medina, P., Canelon, J., Kordrostami, M., Zhang, J., and Liu, Y. (2020). Integrating students’ perspectives about online learning: A hierarchy of factors. International Journal of Educational Technology in Higher Education. https://doi.org/10.1186/s41239-020-00229-8
|
|
 This work is licensed under a: Creative Commons Attribution 4.0 International License
© ShodhPrabandhan 2026. All Rights Reserved.