|
|
|
|
VAT SHARING FORMULA: A TECHNIQUE THAT CAN UPSET NIGERIA’S MIDDLE TIER GOVERNMENT FINANCES
Mahmood Omeiza (Mudi) Adeiza 1![]()
1 Department
of Accounting, Faculty of Management Sciences, Usmanu Danfodiyo University,
Sokoto, PMB 2346 Sokoto, Nigeria
|
|
|
ABSTRACT |
|
|
This study
examines the potential impact of proposed changes to Nigeria's Value Added
Tax (VAT) revenue sharing formula on the financial resources available to
states and the Federal Capital Territory (FCT). The research investigates
whether the new formula will disproportionately benefit states with high VAT
revenue generation and exacerbate fiscal disparities among states. Using
descriptive statistical analysis of secondary data, the study finds that the
proposed formula will disproportionately favor states with high VAT revenue
generation, such as Lagos, while states like Imo will experience significant
declines in VAT revenue allocation. The study recommends a more equitable VAT
sharing formula, that properly considers the principles of derivation,
equity, and population, as the real factors for addressing fiscal disparities
among states, the FCT and their regions, while promoting fiscal
sustainability. |
|||
|
Received 04 November 2024 Accepted 06 December 2024 Published 31 January 2025 Corresponding Author Mahmood
Omeiza (Mudi) Adeiza, mudillicious@gmail.com DOI 10.29121/ShodhPrabandhan.v2.i1.2025.18 Funding: This research
received no specific grant from any funding agency in the public, commercial,
or not-for-profit sectors. Copyright: © 2025 The
Author(s). This work is licensed under a Creative Commons
Attribution 4.0 International License. With the
license CC-BY, authors retain the copyright, allowing anyone to download,
reuse, re-print, modify, distribute, and/or copy their contribution. The work
must be properly attributed to its author.
|
|||
|
Keywords: Fiscal Disparities, Fiscal Federalism, VAT Sharing
Formula |
|||
1. INTRODUCTION
The Nigerian military government in 1993, enacted the Value Added Tax (VAT) Decree (now VAT Act) after it abrogated the 1986 Sales Tax Act, for a unified collection and redistribution of the consumption tax (VAT). In May 2024, stern controversy over the sharing formula for net VAT revenue available to the three tiers of government in Nigeria erupted. The three tiers had been operating the unified system of collecting and redistributing of net VAT revenue among them until the Presidential Committee on Fiscal Policy and Tax Reforms echoed the need to increase the VAT rate, as well as change the existing sharing formula Vanguard. (2024). VAT, which is being collected at the instance of the Nigeria Customs Service (NCS) and the Federal Inland Revenue Service (FIRS), is shared to all the tiers of government by an existing formula which ensures that the federal government, the 36 states and the Federal Capital Territory, as well as all 774 financially autonomous local government authorities (LGAs) of Nigeria, receive a share from the net VAT revenue.
This study addresses a critical research question: How will the proposed changes to the Value Added Tax (VAT) revenue sharing formula affect the financial resources available to states and the Federal Capital Territory (FCT) in Nigeria? Alternatively, the study is guided by the null hypotheses that the proposed changes to the VAT revenue sharing formula will not be disproportionately beneficial to the states with high VAT revenue generation, nor will the new sharing formula potentially exacerbate fiscal disparities among states. Investigating the aforementioned question, the study provides valuable perceptions into the potential impacts of the proposed VAT revenue sharing formula on state and FCT finances. Thus, this paper delves into the debate on the current and proposed sharing formula for the net VAT revenue – as it concerns the middle tier government (the states, FCT as well as their regions) – with intent to reveal any hidden disadvantages, or undue advantages therein.
The data sources include official records from the Federal Inland Revenue Service (FIRS), National Population Commission (NPC), and other relevant statutes, as well as credible sources. The methodology employed in this study involves a descriptive statistical analysis of secondary data on VAT revenue generation and sharing among states and the FCT in Nigeria. Using descriptive statistics such as percentages, the study analyzes the data to compare the existing and proposed VAT revenue sharing formulas, providing a comprehensive understanding of the potential implications of the proposed changes. Consequently, sampling for this study was purposive, all the states in Nigeria included, because the study analyses required certain aggregate parameters to be fulfilled in order to make generalizeable findings. In this regard, and given that there are three factors by which net VAT revenue due to states and the FCT are shared among them, the first consideration is that the equity factor is taken as an assuage factor. Thus, it is a stabilization factor for the net VAT revenue sharing process.
Next, the states with high population are considered as those states which account for up to, or more than one-thirty-seventh of the population of Nigeria, while those that do not account for up to one-thirty-seventh of the population of Nigeria are considered low population states. The latest population estimates for states in Nigeria sum up to 216,803,930 in total population for the year 2022 NPC. (2020), with states like Kano, Lagos, and Katsina topping the list at: 15,462,177; 13,491,804; and 10,368,483 people respectively. The lowest populations, however, emanate from the Federal Capital Territory, Nassarawa state, and Bayelsa state with: 3,067,457; 2,886,022; and 2,537,375 people respectively. Going by this projected 2024 national population in Nigeria, the assumption put forth surmises that any state which accounts for up to 2.7% or more of Nigeria’s total population has a high population, while states that account for 2.69% or less have a low population. Thus, a greater percentage would signify a greater population magnitude and vice-versa – with Kano and Bayelsa having the greatest and least population magnitudes in terms of their contributions to the national population figure at 7.13% and 1.17% respectively.
Finally, and based on the principle of equity and fairness here adopted as an overlay for ensuring that net VAT revenue sharing is constitutional, any state that is generating VAT as much as, or more than one-thirty-seventh of the total VAT revenue of Nigeria (that is, at least 2.7%) in a period (month, year, etc.) is deemed as generating high VAT, while any state not generating up to one-thirty-seventh of the total VAT revenue of Nigeria (that is, 2.69% or less) in a period is deemed as generating low VAT revenue. Nigeria’s gross VAT revenue generated by states in the month of August 2024 was N444.21bn Oyedokun (2024) and applying the foregoing assumption for high and low generation means that: any state that has generated up to or more than N11.99bn in the month of August 2024 has generating high VAT revenue; while states that generated less than N11.99bn in the month of August 2024 have generated low VAT revenue. Hence, using the August 2024 VAT figures as a basis presumes that the more a state’s generated VAT revenue surpasses 2.7% of the total monthly gross VAT revenue generated in Nigeria, the higher the VAT contribution from that state, and vice versa for any state generating 2.69% or less of the monthly gross VAT revenue generated in Nigeria.
In connection to the foregoing idea, Lagos, Rivers, Oyo, FCT, and Delta states generate the highest VAT revenue as: N249.77bn; N70.54bn; N20.11bn; N18.17bn; and N13.09bn, respectively. Bauchi, Kebbi, Abia, Zamfara, and Imo generate the lowest VAT revenue as: N691.28m; N665.17m; N663.42m; N432.80m; and N235.41m, respectively. Accordingly, and out of necessity, data analyses was conducted for all the states and the FCT to provide a comprehensive interpretation of the issues at stake. Thus, with basic descriptive statistics used as techniques for this study’s data analyses, the comparison of the existing net VAT revenue sharing formula with the proposed net VAT revenue sharing formula has sufficiently and evocatively deciphered the possibility of making or breaking a state by way of the proposed net VAT revenue sharing formula between the tiers of government, particularly among the states and the FCT.
This study contributes significantly to the existing literature on fiscal federalism and tax policy in Nigeria, providing novel insights into the potential impacts of changes to the VAT revenue sharing formula on states’ and the FCT’s finances. The findings of this study have important policy implications for the Nigerian government, highlighting the need for a more equitable VAT revenue sharing formula that takes into account the diverse fiscal capacities and needs of states and the FCT. Ultimately, the study's recommendations can inform policy decisions aimed at promoting fiscal sustainability, reducing inequality, and enhancing economic development among states and the FCT in Nigeria.
2. Conceptual Clarifications
Generally, taxes are a vital tool for governments to promote economic fairness and support national growth. By redistributing income, taxes fund essential public goods and services like infrastructure, education, and healthcare. Taxes also reduce income inequality by bridging the wealth gap, providing financial assistance to low-income individuals, and encouraging economic growth. Ultimately, taxes enable governments to allocate resources efficiently, promoting sustainable development and supporting the well-being of citizens equitably. This makes taxes a crucial component of a country's economic system. Accordingly, VAT, which is a consumption tax, helps governments to generate revenue, which is then redistributed to the tiers of government as equitably as possible, and thereby enabling governments to fund public goods and services, promote economic growth, and reduce income inequality effectively.
The three tiers of government in Nigeria are responsible for collecting various taxes and levies, which are then utilized to fund public services and infrastructure. While the federal government collects taxes such as companies' income tax, value-added tax, and petroleum profits tax, the state governments collect personal income tax, withholding tax, and stamp duties. The local governments, which make up the lowest tier of government, collect taxes and levies at the grassroots, and such taxes include: shop and kiosk rates; tenement rates; and market taxes. Nonetheless, when the federal government collects Value Added Tax (VAT) as prescribed by law, it is shared among the three tiers of government, and the states’ VAT revenue receipts ultimately transcend the regions in economic impacts. The states' VAT revenue receipts can have a significant impact on the economy, not just in their own regions, but also in other parts of the country. This is because VAT is a consumption tax, which is levied on the value added to goods and services at each stage of production and distribution. As a result, the revenue generated from VAT can be substantial, and its allocation can have a ripple effect on the economy.
Redistributing net VAT revenue in Nigeria is by a series of formula. The primary concern of this study is with regards to the VAT sharing formula among states and the FCT, as well as their regions. The VAT sharing formula is based on three key sharing factors established by the VAT Act (1993) – the principles of: derivation, equality (equalization), and population. These principles serve as justifications for the amount of net VAT revenue shared to states based on: the amount of VAT generated within a state; the amount of VAT earmarked for equalization (sharing based on equity); and the amount of VAT shared based on population magnitude. Thus, while derivation is the amount of VAT (or the volume of VAT revenue in naira) generated within a state, equalization refers to the amount of VAT earmarked for equitable sharing to support less economically developed states, and population remains a demographic factor used to determine the amount of VAT shared to states based on their population magnitude Olofin et al. (2012) Zee (2008).
However, due to the absence of a working definition for the term ‘derivation’ in the legal documents that presently regulate VAT administration in Nigeria Idris (2024); Finance Act (2020); & Value Added Tax (Amendment) Act (2007)), the federal government loosely applies the term in a manner suggesting that VAT as a consumption tax is generated in the states hosting the headquarters of companies that on behalf of government, collect and remit VAT to the FIRS. This discretionary interpretation of ‘derivation’ has allowed for states headquartering the VAT remitting companies to take the bulk of the net VAT revenue being shared under the derivation factor. Quite unfortunately, this arbitrary trend has yet again eluded the federal government as its proposed bills (NTAB, 2024; & NTB, 2024) have not defined the term ‘derivation’ as well.
3. Theoretical Review
The combination of the three principles (derivation, equalization, and population) by which net VAT revenue is shared among states and the FCT is expected to: promote economic development, reduce regional fiscal disparities, and ensure a more equitable distribution of resources among states. The bills being proposed by the federal government: The Nigeria Tax Bill (2024), The Tax Administration Bill (2024), The Nigeria Revenue Service (Establishment) Bill (2024), and The Joint Revenue Board (Establishment) Bill (2024), stirred a great deal of controversy, particularly regarding the sharing formula for Nigeria’s net VAT revenue because they seek to negate the equalization principle as preserved by the VAT Act (1993). The bills propose to change the net VAT revenue sharing formula by reducing the federal government’s share from 15% to 10%, as well as change the sharing formula through the inclusion of a caveat that the allocation among states will factor in the derivation principle at 60% rather than the traditional 20%.
Clearly, the intention of the federal government is to ensure that every state receives credit for the economic activities within their jurisdiction by keeping – as much as possible – the net VAT revenue generated in their domains. This is quite contrary to what a tax system (including the VAT revenue sharing formula) is supposed to do, which is to be designed to strike a balance between rewarding states that generate more VAT revenue (derivation), supporting less economically developed states (equalization), and recognizing the needs of states with greater population magnitude Ordu and Omesi (2022). This paper, therefore hinges on the theory of Fiscal Federalism because it focuses on distribution of power and financial resources among different tiers of government Hanif et al. (2020), aiming to promote economic development Mfon et al. (2024); Vasilyeva (2023); & Jin et al. (2005), reduce regional fiscal disparities while ensuring equitable distribution of resources such as the VAT revenue Sorens (2012).
While fiscal federalism theory offers several strengths, including promoting decentralization and economic development, it also has several limitations. One of the significant challenges is the potential for inequality among states, as some states may have more resources and revenue-generating capacity than others. In the Nigerian context, the implementation of fiscal federalism theory is further complicated by the country's complex ethnic and religious diversity, which can create tensions and conflicts over resource allocation. Moreover, the key issues of fiscal federalism in this paper are: the revenue and expenditure decentralization processes – which both positively impact economic development in Nigeria Nkoro and Otto (2023); & Ewetan et al. (2020) as well as the ability for fiscal federalism to boost economic development, while addressing regional fiscal disparities among states with higher production and revenue generation capacities (such as Lagos, Rivers, and Oyo) that have achieved better socioeconomic outcomes when compared with smaller states (such as Abia, Zamfara, and Imo).
Consequently, allocating greater resources to weaker states reduces fiscal disparities within Nigeria’s middle tier government, impacts public spending patterns, and promote development Nteegah (2023), there is need for more efficient allocation of resources and strengthening of state government by addressing revenue shortages and imbalances in federal government allocations to state governments Chenge (2024). By applying the fiscal federalism theory, this study provides a framework for understanding the distribution of VAT revenue among states and its implications for economic development and regional equality. The findings of this study will contribute significantly to the understanding of fiscal federalism theory and its application in the Nigerian context, providing valuable insights for policymakers and stakeholders.
4. Challenges in VAT Revenue Sharing
When reviewing VAT revenue sharing or allocation, several empirical issues arise due to the complex interplay of economic, social, and political factors. These issues include challenges related to data quality and availability, as well as methodological difficulties in analyzing the relationships between VAT revenue and various economic indicators.
1) Data
Quality and Methodological Challenges
In the case of Data Quality and Availability, there is limited access to up-to-date and reliable data on VAT revenue, economic indicators, and demographic factors are often restricted, which can either hinder availability of accurate data or thwart accurate data analysis. These are particularly evident in developing countries like Nigeria where data collection systems may not be robust Sackey et al. (2014); & Unegbu and Irefin (2011)). There is also the issue of inconsistencies in data collection, due to differences in how VAT data is collected and reported across regions – thereby leading to inconsistencies, complicating comparative analyses and policy evaluations Mascagni et al. (2019).
In the case of Methodological Challenges, econometric model selection, for choosing appropriate econometric models to analyze the relationships between VAT revenue and economic growth, income inequality, and consumption patterns is complex. The selection of models must account for regional differences in economic structures and fiscal capacities (Zhang (2021); & Zee (2008)). Then there is also the impact of VAT revenue on economic indicators which studies have shown that ‘VAT’ impacts economic and human development significantly, but the effects can vary widely depending on local governance and economic conditions. This variability necessitates careful methodological consideration to accurately capture these effects (Chicu (2022); & Unegbu and Irefin (2011)). In addition, inter-jurisdictional sharing, which is the optimal arrangement for sharing VAT revenue between different levels of government involves complex interactions among population, income, and local government expenditure. This requires sophisticated modeling to derive solutions that balance these factors effectively Zee (2008).
Other issues are: endogeneity and reverse causality, because VAT revenue may be influenced by economic growth, while economic growth may also be influenced by VAT revenue; heterogeneity across states and regions – because of the differences in economic structures, industry composition, and demographic characteristics across states and regions. Also, policy and institutional factors, such as changes in tax policies, institutional frameworks, and administrative capacities can influence the effectiveness of VAT revenue sharing or allocation, as well as the date (time-series and cross-sectional) variations. Thus, analyzing VAT revenue sharing or allocation requires considering both time-series and cross-sectional variations, which can be both complex and shady.
2) VAT
Revenue Sharing in Nigeria: Challenges and Controversies
Across the governments in Nigeria, VAT collected by Federal Inland revenue Service (FIRS) is shared using a unique formula that been in place since 1993 (Vat Act (1993)). Controversies about VAT revenue sharing formula in Nigeria are not new (Onuigbo and Eme (2015); Sarumi (1982) and in November 2024, the Tinubu-Administration proposed a new VAT revenue sharing formula which led to more controversies. Tunji (2024)), seeing the crises that ensued there from, was quick to espouse the issues leading to the dispute between the Presidential Fiscal Policy and Tax Reforms Committee (PFPTRC) and the Revenue Mobilization Allocation and Fiscal Commission (RMAFC) over the administration and allocation of VAT revenues in Nigeria. The issues bordered on: constitutional interpretation; the VAT sharing formula; administrative challenges; and way forward.
Regarding the Constitutional Interpretation, RMAFC argued that VAT allocation should adhere to the principles of fairness and equity outlined in the 1999 Constitution, while the Presidential Committee contended that VAT is a state tax that predates the 1999 Constitution. On the current sharing formula for VAT revenue, some states continue their call for a derivation-based model that allocates revenues based on consumption within their jurisdictions Tunji (2024). In addition, there are Administrative Challenges, and RMAFC points to administrative challenges in tracking VAT consumption across states, citing the lack of robust digital infrastructure. Despite the Presidential Committee arguing that existing input-output VAT mechanisms are sufficient. Both parties have proposed that solutions via constructive dialogue can address the VAT allocation controversy amicably. For now, the solutions proposed, include developing a VAT formula that balances derivation, equity, and consumption, engaging stakeholders, amending VAT laws, and improving digital infrastructure.
3) Research
Gap
The empirical issues in VAT revenue sharing are multifaceted, involving challenges in data quality and methodological approaches. Reliable data collection and sophisticated econometric modeling are crucial for understanding the impact of VAT on economic indicators and for designing effective revenue-sharing mechanisms. In particular, the income redistribution streak that VAT provides in Nigeria is being challenged by some quarters. In fact, Egboboh (2024) maintains that the Presidential Committee on Fiscal Policy and Tax Reforms proposed the tax bills now in contention in an effort to strengthen Nigeria’s tax system and address abnormalities in the system. Addressing these challenges is essential for optimizing Nigeria’s VAT systems and ensuring equitable fiscal policies across regions and states.
Despite the existing literature on VAT revenue sharing, there is a need for more research on specific contexts in Nigeria, particularly in light of the recent proposals to reform the VAT sharing formula. The current study aims to fill the research gap by examining the effects of the proposed VAT sharing formula on the Nigerian economy. Specifically, this study seeks to analyze the impact of the new VAT sharing formula on income inequality in Nigeria by using descriptive statistics for the data analysis. This study aims to provide insights into the potential effects of the proposed VAT sharing formula on the financial resources of state governments in Nigeria, and contribute to the ongoing debate on VAT revenue sharing in Nigeria.
5. Data Presentation and Analyses
This paper makes a fastidiously exclusive use of descriptive statistics to explain and derive inference there from. The study data presentation (see tables 1 to 8), provide a clear view of the issues at stake, while the data analyses in tables 9 and 10 use mean, percentages and graphs to outline the possible outcomes in shifting from the current to the proposed net VAT revenue sharing formula.
Data Presentation
The present net VAT revenue sharing formula between the three tiers of government in Nigeria is as presented in Table 1 below. State Governments enjoy a half (50%) of the total net VAT revenue being shared to all three tiers of government while the federal and local governments receive 15% and 35% respectively. This formula is outlined in Section 40 of the Value Added Tax Act (VAT) 1993.
Table 1
|
Table
1 Nigeria’s Current VAT Sharing Formula across the
Tiers of Governments |
|
|
Categories |
Current (%) |
|
Federal Government |
15 |
|
State Governments |
50 |
|
Local Governments |
35 |
|
Source VAT Act, No.102, 1993,
s.40; VAT (Amendment) Act, No.30, 1999, s.11; and VAT (Amendment) Act, No.53,
2007, s.11. |
|
Presented in Table 2, is Nigeria's proposed VAT sharing formula as outlined in Section 77 of the proposed Nigeria Tax Administration Bill (NTAB), 2024. This proposed formula aims to reduce the federal government's share and allocate more to state governments, while maintaining the local governments' share. Thus, proposing a 5% decrease from the current formula with regards to the federal government’s share, a 5% increase on the current formula with regards to the state governments’ share, while maintaining zero change in the current formula in the case of the local governments’ share.
Table 2
|
Table
2 Nigeria’s Proposed VAT
Sharing Formula across the Tiers of Governments |
|
|
Categories |
Proposed (%) |
|
Federal Government |
10 |
|
State Governments |
55 |
|
Local Governments |
35 |
|
Source Nigeria Tax
Administration Bill (NTAB), No.HB1756, 2024, s.77. |
|
As can be juxtaposed from Table 1 and Table 2 above, to increase the allocation to state governments and the FCT by 10% (that is, from 50% to 55%), the federal government opted to forfeit 33% of its share (thus from 15% to 10%). This action attempted to push more resources towards Lagos state in view of 60% of the VAT revenue now assigned for sharing based on the derivation principle (see Table 3 below). Lagos state alone accounted for 56.23% of the total national VAT revenue generated in August 2024 therefore it is not difficult to understand the general backlash that Lagos state will gulp a great percentage of the amount assigned under the derivation principle to be shared to state governments and the FCT.
Table 3
|
Table
3 Nigeria’s proposed net VAT revenue Sharing Formula
among State Governments and the FCT |
|
|
Sharing Factors |
Proposed (%) |
|
Derivation |
60 |
|
Equity (Equalization) |
20 |
|
Population |
20 |
|
Source Nigeria Tax Administration
Bill (NTAB), No.HB1756, 2024, s.77; Nwokoji (2024) |
|
Table 4 shows that traditionally, the state governments shared 50% of the net VAT revenue by way of equalization, then 30% by population, and 20% by derivation but the proposed changes to Nigeria's net VAT revenue sharing formula among state governments and the FCT can create a major shift in how net VAT revenue is shared if actualized. Adjusting the ratio between sharing factors (see Table 4) would place a much greater emphasis on derivation. This means that states with higher VAT generation would receive a larger share of the net VAT revenue. On the other hand, the emphasis on equity and population would be reduced, potentially impacting states with smaller populations or lower VAT generation capacities.
Table 4
|
Table
4 Nigeria’s current net VAT revenue Sharing Formula
among State Governments and the FCT |
|
|
Sharing
Factors |
Current
(%) |
|
Derivation |
20 |
|
Equity
(Equalization) |
50 |
|
Population |
30 |
|
Source VAT Act, No.102, 1993, s.40; Yusuf (2024) |
|
Table 5 provides Nigeria’s 2022 population projections by states. The data shows Kano has the highest population (15,462,177), while Bayelsa has the least population (2,537,375). The population projections vary significantly across states, with mean population at 5,859,566 – which is at least 2.70% of Nigeria’s total national population. The table provides a basis (see magnitude column) for understanding the population distribution across Nigeria's states for VAT revenue sharing decisions. Comparing states’ population against the national average reveals that while Kano exceeds the national population average by at least 164%, Bayelsa is below the national population average by more than 56%.
Table 5
|
Table
5 Nigeria’s
2022 States’ Population Projections by Magnitude |
||||
|
S/N |
States |
Population |
As a % of the Total |
Magnitude |
|
1 |
1,54,62,177 |
7.13 |
96,02,611 |
|
|
2 |
1,34,91,804 |
6.22 |
76,32,238 |
|
|
3 |
1,03,68,483 |
4.78 |
45,08,917 |
|
|
4 |
90,32,181 |
4.17 |
31,72,615 |
|
|
5 |
83,08,783 |
3.83 |
24,49,217 |
|
|
6 |
79,76,081 |
3.68 |
21,16,515 |
|
|
7 |
74,99,059 |
3.46 |
16,39,493 |
|
|
8 |
74,76,805 |
3.45 |
16,17,239 |
|
|
9 |
67,83,325 |
3.13 |
9,23,759 |
|
|
10 |
63,91,047 |
2.95 |
5,31,481 |
|
|
11 |
63,79,532 |
2.94 |
5,19,966 |
|
|
12 |
61,41,284 |
2.83 |
2,81,718 |
|
|
13 |
61,11,462 |
2.82 |
2,51,896 |
|
|
14 |
59,53,517 |
2.75 |
93,951 |
|
|
15 |
58,33,494 |
2.69 |
-26,072 |
|
|
16 |
56,36,145 |
2.6 |
-2,23,421 |
|
|
17 |
55,63,907 |
2.57 |
-2,95,659 |
|
|
18 |
54,59,337 |
2.52 |
-4,00,229 |
|
|
19 |
53,16,603 |
2.45 |
-5,42,963 |
|
|
20 |
49,79,418 |
2.3 |
-8,80,148 |
|
|
21 |
49,02,055 |
2.26 |
-9,57,511 |
|
|
22 |
47,77,042 |
2.2 |
-10,82,524 |
|
|
23 |
47,17,305 |
2.18 |
-11,42,261 |
|
|
24 |
46,90,053 |
2.16 |
-11,69,513 |
|
|
25 |
44,66,801 |
2.06 |
-13,92,765 |
|
|
26 |
44,35,803 |
2.05 |
-14,23,763 |
|
|
27 |
44,06,204 |
2.03 |
-14,53,362 |
|
|
28 |
41,48,093 |
1.91 |
-17,11,473 |
|
|
29 |
39,60,122 |
1.83 |
-18,99,444 |
|
|
30 |
36,49,607 |
1.68 |
-22,09,959 |
|
|
31 |
36,09,843 |
1.67 |
-22,49,723 |
|
|
32 |
35,92,163 |
1.66 |
-22,67,403 |
|
|
33 |
35,51,023 |
1.64 |
-23,08,543 |
|
|
34 |
32,42,518 |
1.5 |
-26,17,048 |
|
|
35 |
30,67,457 |
1.41 |
-27,92,109 |
|
|
36 |
28,86,022 |
1.33 |
-29,73,544 |
|
|
37 |
25,37,375 |
1.17 |
-33,22,191 |
|
|
Total Figures |
21,68,03,930 |
100 |
||
|
Mean Figures |
58,59,566 |
2.7 |
||
|
Source Year 2022
Population Estimation by National Population Commission (2020). |
||||
Table 6
|
Table
6 Nigeria’s 2023 Actual
VAT Collection (in billions of naira) |
|||||||
|
VAT Type |
Annual Target |
Quarterly Target |
Actual (Q1) |
Actual (Q2) |
Actual (Q3) |
Actual (Q4) |
Horizontal Total |
|
Non-Import VAT |
822.67 |
205.67 |
587.22 |
654.66 |
726.66 |
956.26 |
2,924.81 |
|
NCS-Import VAT |
2,323.26 |
580.82 |
122.37 |
126.69 |
221.41 |
244.04 |
714.51 |
|
Vertical Total |
3,145.93 |
786.49 |
709.59 |
781.35 |
948.07 |
1,200.30 |
3,639.32 |
|
Source Planning, Research, and
Statistics Department, FIRS. |
|||||||
VAT collection by regions for the year 2023, which is the most current and complete data for a year period presently available in Nigeria, reveals that Non-Import VAT dominates Nigeria's VAT revenue. Table 6 shows that Non-Import VAT accounts for 80.37% of VAT collection to the tune of N2.92 trillion, while NCS-Import VAT collection is significantly lower at about 19.63% 20 (that is, N714.51 billion).
Table 7
|
Table
7 Nigeria’s
2023 VAT Generated vs. Net VAT Received by Regions (in billions of naira) |
|||||
|
S/N |
Regions |
States |
VAT Generated by Regions (A) |
VAT distributed to Regions (B) |
(B) as a % of (A) |
|
1 |
Ekiti, Lagos, Osun, Ondo, Ogun, and Oyo. |
2,499.00 |
685.91 |
27 |
|
|
2 |
Akwa-Ibom, Bayelsa, Cross-River, Delta, Edo, and
Rivers. |
887.57 |
441.78 |
50 |
|
|
3 |
Kaduna, Katsina, Kano, Kebbi, Sokoto, Jigawa, and
Zamfara. |
161.75 |
463.86 |
287 |
|
|
4 |
Adamawa, Bauchi, Borno, Gombe, Taraba, and Yobe. |
148.16 |
334.43 |
226 |
|
|
5 |
Benue, Kogi, Kwara, Nassarawa, Niger, and Plateau. |
127.4 |
331.3 |
260 |
|
|
6 |
Abia, Anambra, Ebonyi, Enugu, and Imo. |
84.94 |
286.89 |
338 |
|
|
Total |
3,908.82 |
2,544.17 |
|||
|
Source Authors
Tabulation based on Egboboh (2024), Businessday report. |
|||||
Table 7 compares VAT revenue generated and net VAT revenue received by regions. The South-West region generates the most VAT revenue (N2.49 trillion), but when compared to what it receives, the South-West receives the least percentage in terms of net VAT revenue (27%). In this regard, the South-East receives the highest percentage of net VAT revenue (338%) despite generating the least VAT revenue (N84.94 billion). Indeed there is great regional disparity in Nigeria’s VAT generation and receipt.
No data on net VAT revenue distribution for the month of August 2024 was obtained but quite comparable to Table 7 above, is table 8 below, which highlights the significant variation in VAT revenue generation across states and the FCT in August 2024. Lagos and Rivers State generated the most VAT revenue (N249.77bn and N70.54bn, respectively). Several states generated relatively low VAT (e.g., Zamfara and Imo, which generated N432.8m, and N235.41m, respectively). The disparity with regards to VAT revenue generation between Nigerian states is so great that Lagos, Rivers, Oyo, and the FCT jointly accounted for over 80% of the total national VAT revenue generated, while individually accounting for 56.23%, 15.88%, 4.53%, and 4.09%, in the same order. This suggests a significant imbalance in economic activity across the country.
Table 8
|
Table 8 August 2024 VAT Revenue Generated by States/FCT across Nigeria (in millions of naira) |
|||
|
S/N |
States |
VAT Revenue Generated |
As a % of the Total |
|
1 |
Lagos |
2,49,770.00 |
56.23 |
|
2 |
Rivers |
70,540.00 |
15.88 |
|
3 |
Oyo |
20,110.00 |
4.53 |
|
4 |
FCT |
18,170.00 |
4.09 |
|
5 |
Delta |
13,090.00 |
2.95 |
|
6 |
Bayelsa |
7,120.00 |
1.6 |
|
7 |
Kano |
4,650.00 |
1.05 |
|
8 |
Akwa-Ibom |
4,490.00 |
1.01 |
|
9 |
Anambra |
4,280.00 |
0.96 |
|
10 |
Edo |
4,050.00 |
0.91 |
|
11 |
Ekiti |
3,660.00 |
0.82 |
|
12 |
Borno |
3,000.00 |
0.68 |
|
13 |
Kwara |
2,890.00 |
0.65 |
|
14 |
Adamawa |
2,590.00 |
0.58 |
|
15 |
Plateau |
2,580.00 |
0.58 |
|
16 |
Benue |
2,560.00 |
0.58 |
|
17 |
Gombe |
2,550.00 |
0.57 |
|
18 |
Kogi |
2,430.00 |
0.55 |
|
19 |
Kaduna |
2,030.00 |
0.46 |
|
20 |
Ebonyi |
1,900.00 |
0.43 |
|
21 |
Taraba |
1,880.00 |
0.42 |
|
22 |
Sokoto |
1,840.00 |
0.41 |
|
23 |
Osun |
1,810.00 |
0.41 |
|
24 |
Ogun |
1,740.00 |
0.39 |
|
25 |
Niger |
1,730.00 |
0.39 |
|
26 |
Yobe |
1,710.00 |
0.38 |
|
27 |
Katsina |
1,680.00 |
0.38 |
|
28 |
Jigawa |
1,590.00 |
0.36 |
|
29 |
Nassarawa |
1,470.00 |
0.33 |
|
30 |
Ondo |
1,450.00 |
0.33 |
|
31 |
Enugu |
1,080.00 |
0.24 |
|
32 |
Cross River |
1,080.00 |
0.24 |
|
33 |
Bauchi |
691.28 |
0.16 |
|
34 |
Kebbi |
665.17 |
0.15 |
|
35 |
Abia |
663.42 |
0.15 |
|
36 |
Zamfara |
432.8 |
0.1 |
|
37 |
Imo |
235.41 |
0.05 |
|
Total Figures |
4,44,208.08 |
100 |
|
|
Mean Figures |
12,005.62 |
2.7 |
|
|
Source Author’s Tabulation based on
Oyedokun (2024), Businessday report. |
|||
6. Data Analyses
The data analyses presented in Table 9 and Table 10 provide a comprehensive overview of the potential impact of the proposed VAT sharing formula on states' revenue and regional income redistribution in Nigeria. The proposed formula increases the VAT revenue percentage shared based on derivation by 200%, while reducing the percentage shared based on equality and population by 60% and 33%, respectively. This change is expected to have a significant impact on the revenue of various states, with some states experiencing substantial gains and others facing significant losses.
Table 9
|
Table
9 Exploratory
Redistribution of N1m to States and the FCT using the Current vs. the
Proposed Sharing Formula |
||||||||||||
|
Current
Sharing Formula |
Proposed
Sharing Formula |
Change
(Rise or Fall) |
||||||||||
|
S/N |
States |
Derivation
(20%) |
Equality
(50%) |
Population
(30%) |
Total
(100%) |
Derivation
(60%) |
Equality
(20%) |
Population
(20%) |
Total
(100%) |
( |
(%) |
|
|
1 |
Lagos |
1,12,456 |
13,514 |
18,669 |
1,44,639 |
3,37,369 |
5,405 |
12,446 |
3,55,220 |
2,10,581 |
145.59 |
|
|
2 |
Rivers |
31,760 |
13,514 |
10,346 |
55,619 |
95,280 |
5,405 |
6,897 |
1,07,582 |
51,963 |
93.43 |
|
|
3 |
Oyo |
9,054 |
13,514 |
11,037 |
33,605 |
27,163 |
5,405 |
7,358 |
39,926 |
6,322 |
18.81 |
|
|
4 |
FCT |
8,181 |
13,514 |
4,245 |
25,939 |
24,543 |
5,405 |
2,830 |
32,778 |
6,839 |
26.36 |
|
|
5 |
Delta |
5,894 |
13,514 |
7,799 |
27,206 |
17,681 |
5,405 |
5,199 |
28,286 |
1,080 |
3.97 |
|
|
6 |
Bayelsa |
3,206 |
13,514 |
3,511 |
20,230 |
9,617 |
5,405 |
2,341 |
17,363 |
-2,867 |
-14.17 |
|
|
7 |
Kano |
2,094 |
13,514 |
21,396 |
37,003 |
6,281 |
5,405 |
14,264 |
25,950 |
-11,053 |
-29.87 |
|
|
8 |
Akwa-Ibom |
2,022 |
13,514 |
6,890 |
22,425 |
6,065 |
5,405 |
4,593 |
16,064 |
-6,362 |
-28.37 |
|
|
9 |
Anambra |
1,927 |
13,514 |
8,238 |
23,679 |
5,781 |
5,405 |
5,492 |
16,679 |
-7,000 |
-29.56 |
|
|
10 |
Edo |
1,823 |
13,514 |
6,610 |
21,947 |
5,470 |
5,405 |
4,407 |
15,283 |
-6,665 |
-30.37 |
|
|
11 |
Ekiti |
1,648 |
13,514 |
4,971 |
20,132 |
4,944 |
5,405 |
3,314 |
13,663 |
-6,469 |
-32.13 |
|
|
12 |
Borno |
1,351 |
13,514 |
8,457 |
23,321 |
4,052 |
5,405 |
5,638 |
15,095 |
-8,226 |
-35.27 |
|
|
13 |
Kwara |
1,301 |
13,514 |
4,914 |
19,728 |
3,904 |
5,405 |
3,276 |
12,585 |
-7,144 |
-36.21 |
|
|
14 |
Adamawa |
1,166 |
13,514 |
6,783 |
21,463 |
3,498 |
5,405 |
4,522 |
13,426 |
-8,037 |
-37.45 |
|
|
15 |
Plateau |
1,162 |
13,514 |
6,528 |
21,203 |
3,485 |
5,405 |
4,352 |
13,242 |
-7,961 |
-37.55 |
|
|
16 |
Benue |
1,153 |
13,514 |
8,498 |
23,164 |
3,458 |
5,405 |
5,665 |
14,529 |
-8,636 |
-37.28 |
|
|
17 |
Gombe |
1,148 |
13,514 |
5,480 |
20,141 |
3,444 |
5,405 |
3,653 |
12,503 |
-7,638 |
-37.92 |
|
|
18 |
Kogi |
1,094 |
13,514 |
6,181 |
20,788 |
3,282 |
5,405 |
4,121 |
12,808 |
-7,980 |
-38.39 |
|
|
19 |
Kaduna |
914 |
13,514 |
12,498 |
26,926 |
2,742 |
5,405 |
8,332 |
16,479 |
-10,446 |
-38.8 |
|
|
20 |
Ebonyi |
855 |
13,514 |
4,487 |
18,856 |
2,566 |
5,405 |
2,991 |
10,963 |
-7,893 |
-41.86 |
|
|
21 |
Taraba |
846 |
13,514 |
4,995 |
19,355 |
2,539 |
5,405 |
3,330 |
11,275 |
-8,080 |
-41.75 |
|
|
22 |
Sokoto |
828 |
13,514 |
8,844 |
23,185 |
2,485 |
5,405 |
5,896 |
13,786 |
-9,399 |
-40.54 |
|
|
23 |
Osun |
815 |
13,514 |
6,138 |
20,466 |
2,445 |
5,405 |
4,092 |
11,942 |
-8,524 |
-41.65 |
|
|
24 |
Ogun |
783 |
13,514 |
8,828 |
23,125 |
2,350 |
5,405 |
5,885 |
13,641 |
-9,484 |
-41.01 |
|
|
25 |
Niger |
779 |
13,514 |
9,386 |
23,679 |
2,337 |
5,405 |
6,258 |
14,000 |
-9,679 |
-40.88 |
|
|
26 |
Yobe |
770 |
13,514 |
5,050 |
19,334 |
2,310 |
5,405 |
3,367 |
11,082 |
-8,252 |
-42.68 |
|
|
27 |
Katsina |
756 |
13,514 |
14,347 |
28,617 |
2,269 |
5,405 |
9,565 |
17,239 |
-11,378 |
-39.76 |
|
|
28 |
Jigawa |
716 |
13,514 |
10,377 |
24,606 |
2,148 |
5,405 |
6,918 |
14,471 |
-10,135 |
-41.19 |
|
|
29 |
Nassarawa |
662 |
13,514 |
3,994 |
18,169 |
1,986 |
5,405 |
2,662 |
10,053 |
-8,116 |
-44.67 |
|
|
30 |
Ondo |
653 |
13,514 |
7,357 |
21,523 |
1,959 |
5,405 |
4,905 |
12,268 |
-9,255 |
-43 |
|
|
31 |
Cross
River |
486 |
13,514 |
6,097 |
20,097 |
1,459 |
5,405 |
4,065 |
10,929 |
-9,168 |
-45.62 |
|
|
32 |
Enugu |
486 |
13,514 |
6,490 |
20,490 |
1,459 |
5,405 |
4,327 |
11,191 |
-9,299 |
-45.38 |
|
|
33 |
Bauchi |
311 |
13,514 |
11,497 |
25,322 |
934 |
5,405 |
7,665 |
14,004 |
-11,318 |
-44.7 |
|
|
34 |
Kebbi |
299 |
13,514 |
7,699 |
21,512 |
898 |
5,405 |
5,133 |
11,437 |
-10,075 |
-46.84 |
|
|
35 |
Abia |
299 |
13,514 |
5,740 |
19,552 |
896 |
5,405 |
3,827 |
10,128 |
-9,424 |
-48.2 |
|
|
36 |
Zamfara |
195 |
13,514 |
8,072 |
21,780 |
585 |
5,405 |
5,381 |
11,371 |
-10,409 |
-47.79 |
|
|
37 |
Imo |
106 |
13,514 |
7,554 |
21,174 |
318 |
5,405 |
5,036 |
10,760 |
-10,414 |
-49.18 |
|
|
2,00,000 |
5,00,000 |
3,00,000 |
10,00,000 |
6,00,000 |
2,00,000 |
2,00,000 |
10,00,000 |
- |
|
|||
|
Source Authors Computation based on
tables 1, 2, 5, and 6. |
||||||||||||
Table 9 above, demonstrates the potential impact of the proposed VAT sharing formula on states' revenue by comparing the current and proposed VAT sharing formulas. The proposed formula increases VAT revenue percentage to be shared based on derivation by 200%, but reduces VAT revenue percentage to be shared based on equality and population by 60% and 33%, respectively. Consequently, Lagos State stands the greatest advantage from the proposed sharing formula – to rake in an additional 145.59% of what it would have received based on the current sharing formula. Thus, in every 1 million shared as VAT revenue to states and the FCT in Nigeria using the proposed sharing formula, Lagos state will receive a rise of N210,581 in addition to what it was originally due to receive (N144,639) – bringing Lagos state’s net VAT revenue up to 35.52% of the total amount shared among states and the FCT, instead of the traditional 14.46% that is due to the state based on the current sharing formula.
Contrasting drastically with this outcome, is the case of Imo state which shall suffer a fall of 49.18% of what it would have received based on the current sharing formula. Thus, in every N1m shared as VAT revenue to states and the FCT using the proposed sharing formula, Imo state will suffer a fall of N10,414 out of what it was originally due to receive (N21,172) – bringing Imo state’s net VAT revenue down to 1.08% of the total amount shared among states and the FCT, instead of the traditional 1.35% it receives based on the current sharing formula. In like manner, Table 10, hereunder, elaborates a worsened income redistribution disparity at the regional level.
Table 10
|
Table
10 Exploratory Redistribution of N1m to Nigeria’s
Regions using the Current vs. the Proposed Sharing Formula |
|||||
|
S/N |
Region |
Formula |
Change |
S/N |
Region |
|
Current ( |
Proposed ( |
( |
(%) |
||
|
1 |
NC |
126,731.23 |
77,216.49 |
1 |
NC |
|
2 |
NE |
128,935.60 |
77,384.73 |
2 |
NE |
|
3 |
NW |
183,629.63 |
110,734.10 |
3 |
NW |
|
4 |
SE |
103,749.89 |
59,719.90 |
4 |
SE |
|
5 |
SS |
167,525.00 |
195,506.29 |
5 |
SS |
|
6 |
SW |
263,489.72 |
446,660.82 |
6 |
SW |
|
7 |
FCT |
25,938.92 |
32,777.66 |
7 |
FCT |
|
Total |
1,000,000.00 |
1,000,000.00 |
Total |
||
|
Source Author’s
Computation based on table 9. |
|||||
In Table 10, regional shifts in the distribution of income are observed. While the North-Central (NC), North-East (NE), North-West (NW), and South-East (SE) regions experience significant reductions in net VAT revenue allocations under the proposed formula, ranging from 39.07% to 42.44%, the South-South (SS) region benefits from the proposed formula, with a likely increase of 16.70% in net VAT revenue allocation. The South-West (SW) region, however, experiences the largest increase in net VAT revenue allocation under the proposed formula, with a 69.52% rise. Worthy of note, the Federal Capital Territory (FCT) sees a moderate increase of 26.36% in net VAT revenue allocation under the proposed formula. Overall, the proposed VAT sharing formula appears to favor the South-South and South-West regions, while reducing allocations to the North-Central, North-East, North-West, and South-East regions. Clearly, this presents a geographically biased redistribution. The proposed VAT sharing formula seems to favor the South-West, the South-South regions, while significantly reducing allocations to the South-East and all of the northern regions. This redistribution may exacerbate already existing fiscal disparities, potentially worsening Nigeria’s imbalanced economic growth.
7. Test of Hypothesis
The study's findings provide evidence to reject the null hypotheses that the proposed changes to the VAT revenue sharing formula will not be disproportionately beneficial to the states with high VAT revenue generation, nor will the new sharing formula potentially exacerbate fiscal disparities among states. The descriptive statistics analyses reveal that the proposed VAT sharing formula, which increases VAT revenue percentage to be shared based on derivation by 200%, will indeed favor states with high VAT revenue generation, such as Lagos State, which is expected to receive a 145.59% increase in VAT revenue allocation. In contrast, states with lower VAT revenue generation, such as Imo State, will experience a significant decline of 49.18% in VAT revenue allocation.
Furthermore, the study's findings indicate that the proposed formula will exacerbate fiscal disparities among states, with some regions (South-South and South-West) benefiting from the new formula, while the others (North-Central, North-East, North-West, and South-East) experiencing significant reductions in VAT revenue allocations. The rejection of the null hypotheses suggests that the proposed changes to the VAT revenue sharing formula will have a disproportionate impact on states and regions, potentially widening the fiscal gap between them.
Therefore, it is safe to conclude that the proposed VAT sharing formula requires a review to ensure a more equitable distribution of VAT revenue among states and regions, and to mitigate the potential exacerbation of fiscal disparities among them. Below are Graph 1, Graph 2, Graph 3 which illustrate the three main points raised in the test of hypotheses and provide a clear visual representation of the data to support the three findings resulting from the test of hypothesis.
Graph 1
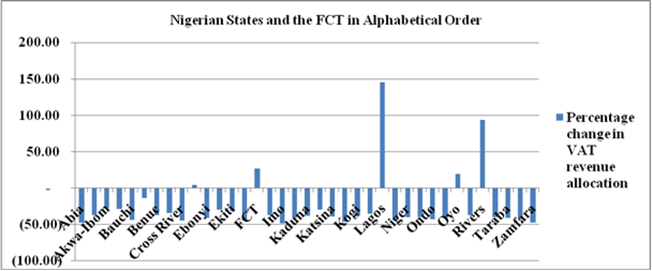
|
Graph 1 Disproportionate
Benefit to States with high VAT Revenue Generation Source Authors
Data Analysis based on table 9. |
The bar chart presented in Graph 1 above provides visual appreciation of the disproportionate benefit of the proposed VAT sharing formula to states with high VAT revenue generation. Only 5 states – Delta, FCT, Oyo, Rivers and Lagos, in this order – enjoy an increase in their VAT revenue allocation, from a mild 3.97% (for Delta State) to as much as 145.59% (for Lagos State). All other states, however, encounter significant losses between 14.17-49.18%.
Graph 2
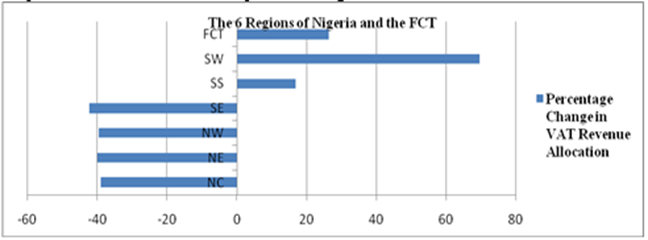
|
Graph 2 Exacerbation of
Fiscal Disparities among States Source Author’s
Data Analysis based on table 10. |
The bar chart in Graph 2 above visualizes the consequential effects that will occur should the exacerbation of fiscal disparities among states (and regions) under the proposed VAT sharing formula were to be allowed. The line chart in Graph 3, buttresses this point further, and provides visual difference in the VAT revenue allocation under the current and proposed formulas thereby highlighting the potential impact of the proposed formula on states.
Graph 3
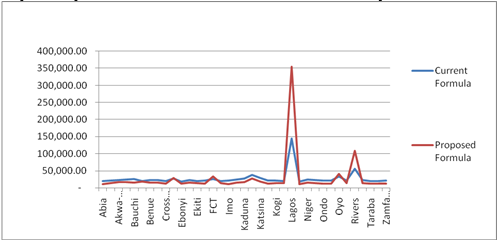
|
Graph 3 Comparison of VAT Revenue Allocation under Current and Proposed VAT Formulas Source Authors Data
Analysis based on table 9. |
8. Findings
Bringing together two or more tables provides a more comprehensive understanding of the data, allowing for a clearer interpretation of the findings. The combination of tables reveals some interesting insights, such as the lack of direct correlation between population magnitude and VAT revenue generation (see tables 5 and 8) as seen in the case of Bauchi State, which has a large population above the average national population but generates relatively low VAT revenue below the average national VAT revenue when compared to Lagos State. Also, Abia and Bayelsa states, which both have populations below the average national population, but while Bayelsa generates high VAT revenue above the average national VAT revenue, Abia generates a very low amount of VAT revenue when compared to the average national VAT revenue. Notwithstanding, the dominance of Non-Import VAT in Nigeria's VAT revenue is another key finding, as indicated by table 6.
In addition, tables 3, 4, 7, 8, and 10 highlight the significant disparities in VAT revenue generation and receipt at the state level, which in turn contributes to income imbalance at the regional level. Furthermore, tables 1, 2 and 9 shows that Lagos State is poised to gain a substantial 35.52% of any increase in the share allocated for redistribution amongst states and the FCT. However, tables 7 and 9 also suggest that the proposed VAT sharing formula may worsen regional fiscal disparities, with some states like Lagos benefiting significantly while others, such as Imo, lose revenue. This underscores the complexities of VAT revenue sharing in Nigeria and the need for a more equitable formula. Hence, in the context of fiscal federalism theory, these findings have significant implications, and are supported by the study descriptive statistics analyses which offer profound explanation of the issues at stake.
9. Conclusion, Recommendations and Policy Implications
The proposed VAT sharing formula in Nigeria has significant implications for the country's economic growth and development. The formula which increases the VAT revenue percentage to be shared based on derivation by 200% but reduces VAT revenue percentage to be shared on equality and population by 60% and 33%, respectively, is likely to exacerbate regional fiscal disparities. Lagos State is poised to gain substantially from the proposed formula, while states like Imo will suffer significant losses. The regional shifts in income distribution also favor the South-South and South-West regions, while reducing allocations to the North-Central, North-East, North-West, and South-East regions.
It is hereby recommended that there should be:
1) The federal government should ensure the VAT sharing formula amongst states and the FCT is supremely equitable. This can be achieved by considering a more balanced approach that takes into account the true essence of taxation as an income redistribution mechanism to address fiscal disparities within the Nigeria.
2) The federal government should implement a more equitable redistribution mechanism between the three tiers of government to address the regional fiscal disparities that already exists. This can include measures such as targeted investments in disadvantaged regions and the establishment of a special fund to support economic development in such areas.
3) Enact statute to assign the use of net VAT revenue by all tiers of government to economic development projects, in a manner that attracts more industrial capital to the already disadvantaged states.
4) Institute regular monitoring and evaluation of the net VAT sharing formula and the intended VAT revenue objectives. Monitoring and evaluation frameworks can track key indicators such as VAT revenue generation, distribution, and impact on regional economic development.
Following the recommendations made above, the respective policy implications are that:
1) The federal government of Nigeria must focus on the redistribution of wealth, and implement a more equitable VAT sharing formula to offer states a significant boost for economic boom, rather than seek to favor a few states at the detriment of other states. In fact, since the various states in Nigeria already have peculiar taxes that they collect directly, then it is expected that VAT which is being administered centrally, should seek to blend the principles of derivation, equity, and population to address fiscal disparities.
2) The federal government needs to encourage state governments to prioritize economic development by investing in infrastructure, education, and healthcare within the disadvantaged regions in order to stimulate economic growth and development.
3) The federal government needs to ensure fiscal federalism is at play so that VAT revenue is allocated in a manner that supports the economic development of all states and regions, rather than just a few.
4) Transparency and accountability should be a continuous process for all tiers of government via regular monitoring and evaluation of the net VAT sharing formula and the intended VAT revenue objectives.
CONFLICT OF INTERESTS
None.
ACKNOWLEDGMENTS
None.
REFERENCES
Chenge, A. A. (2024). Exploring Fiscal Federalism and Structure of Public Spending in Nigeria. Journal of Political Science, 24, 86-102. https://doi.org/10.3126/jps.v24i1.62856
Chicu, N. (2022). The Impact of VAT and Excise Taxes on Some Economic Processes. Competitiveness and Innovation in the Knowledge Economy. September 23-24, 365-372. Chişinău: IREK - AESM: Institutional Repository of Economic Knowledge. https://doi.org/10.53486/cike2022.43
Ede, Y. M. (2024). An Appraisal of the Institutional Framework of Value Added Tax Act in Nigeria. Nnamdi Azikiwe University Journal of Private and Property Law, 1 (1), 112-127.
Egboboh, C. (2024). Explainer: What Each State Contributes to VAT Pool. Business Day Nigeria, News. Lagos: Businessday NG.
Ewetan, O. O., Matthew, O. A., Babajide, A. A., Osabohien, R., & Urhie, E. (2020). Fiscal Federalism and Economic Development in Nigeria: An Auto-regressive Distributed Lag Approach. (E. O. Amoo, Ed.) Cogent Social Sciences, 6 (1), 1-13. https://doi.org/10.1080/23311886.2020.1789370
FIRS. (2024). Tax and Statistics Report. Federal Inland Revenue Service, Planning, Research and Statistics Department. Abuja: FIRS.
Hanif, I., Wallace, S., & Gago-de-Santos, P. (2020). Economic Growth by Means of Fiscal Decentralization: An Empirical Study for Federal Developing Countries. Sage Open, 10 (4), 1-12. https://doi.org/10.1177/2158244020968088
Idris, A. (2024). Value-Added Tax Administration and Allocation Formula Challenges in Nigeria. (M. Kaalappan, R. Rukhmani, & M. Shesny, Eds.) International Journal of Humanities Social Science and Management (IJHSSM), 4 (6), 793-803.
Jin, H., Qian, Y., & Weingast, B. R. (2005). Regional Decentralization and Fiscal Incentives: Federalism, Chinese Style. (W. Kopczuk, Ed.) Journal of Public Economics, 89 (9-10), 1719-1742. https://doi.org/10.1016/j.jpubeco.2004.11.008
Joint Revenue Board of Nigeria (Establishment) Bill (2024). No. HB1758, pgs C4781-C4816, National Assembly Journal (Extraordinary) (October 4, 2024).
Kang, J. (2010). The VAT Reform for Broadening the Tax Base and Adjustment of Intergovernmental Fiscal Relations in China. Finance & Trade Economics.
Kezhong, Z., Wentao, Z., & Xin, W. (2021). Tax Sharing and Fiscal Imbalances: Reconstruction of the VAT Sharing System in China. China Finance and Economic Review, 10 (2), 22-43.
Mascagni, G., Mukama, D., & Santoro, F. (2019). An Analysis of Discrepancies in Taxpayers' VAT Declarations in Rwanda. Joint paper between RRA and ICTD, International Centre for Tax and Development (ICTD), Ruwanda Revenue Authority (RRA).
Mfon, S. U., Enefiok, I., & Sunday, E. I. (2024). Fiscal Federalism and Socio-Economic Development in Akwa Ibom State, Nigeria. (N. G. Nwokah, & B. W. Ateke, Eds.) Nigerian Journal of Management Sciences, 25 (1b), 41-51.
NBS. (2023).
Demographic Statistics Bulletin 2022. National Bureau of Statistics,
Statistics. Abuja: National Bureau of Statistics.
Nigeria
Revenue Service (Establishment) Bill (2024).
No.HB1757, pgs C4751-C4779, National Assembly Journal (Extraordinary) (October
4, 2024).
Nigeria Tax
Administration Bill (2024). No. HB1756, pgs
C4659-C4750, National Assembly Journal (Extraordinary) (October 4, 2024).
Nigeria Tax Bill (2024). 1-213.
Nkoro, E., & Otto, G. (2023). Fiscal Federalism and Economic Development in Nigeria: An Econometric Analysis. International Journal of Economic Science, 12 (1), 127-145. https://doi.org/10.52950/ES.2023.12.1.007
NPC. (2020). Nigeria Population Projections and Demographic Indicators. National Population Commission. Abuja: National Population Commission.
Nteegah, A. (2023). Fiscal Federalism and Socioeconomic Development in Nigeria. (R. B. Johnson, Ed.) International Journal of Multidisciplinary Research and Analysis, 6 (6), 2795-2805. https://doi.org/10.47191/ijmra/v6-i6-81
Nwokoji, C. (2024). Nigeria's Proposed Tax Reform: Diverse Perspectives and a Path to Consensus. Nigerian Tribune. Lagos: Nigerian Tribune.
Olofin, S. O., Olubusayo, O. E., Ajide, B. K., Afees, S. A., & Akintola, O. S. (2012). Fiscal Federalism in Nigeria: A Cluster Analysis of Revenue Allocation to States and Local Government Areas, 1999 - 2008. CBN Journal of Applied Statistics (JAS), 3 (1, Article 4), 65-83.
Onuigbo, R. A., & Eme, O. I. (2015). State Governors and Revenue Allocation Formula in Nigeria: A Case of the Fourth Republic. International Journal of Accounting Research, 2 (7), 14-36. https://doi.org/10.12816/0017348
Ordu, P. A., & Omesi, I. (2022). Value Added Tax (VAT) and Revenue Allocation in Nigeria. (E. I. Okoye, O. M. Eneh, & U. J. Nwoye, Eds.) Journal of Contemporary Issues in Accounting (JOCIA), 3 (1), 1-34.
Oyedokun, T. (2024). Full list: VAT Generated in 36 Nigerian states and FCT in August
2024. Business Day NG, News. Lagos: BusinessdayNG.
Sackey, J. A., & Ejoh, N. O.
(2014). Tax Revenue Allocation and its Effects on
Consumption (VAT): A Study of Calabar Municipal Council, Cross River State. (P.
Gupta, Ed.) Archives of Applied Science Research, 6 (1), 199-208.
Sarumi, S. A. (1982). The Controversy on the Appropriate Revenue Sharing Formula among the States in Nigerian Federation. University of Montana, Graduate School (ScholarWorks). Montana: UMI Dissertation Publishing and ProQuest.
Sorens, J. (2012). Does Fiscal Federalism Promote Regional Inequality? An Empirical Analysis of the OECD, 1980-2005. (J. Clark, Ed.) Regional Studies, 48 (2), 239-253. https://doi.org/10.1080/00343404.2012.661851
Tunji, S. (2024). RMAFC, Tinubu Panel Differ on VAT Sharing Formula. (O. Abioye, Ed.)
PUNCH.
Unegbu, A. O., & Irefin, D.
(2011). Impact of VAT on Economic Development of
Emerging Nations. Journal of Economics and International Finance, 3 (8),
492-503.
Value Added Tax
(Amendment) Act (2007). 12, s. 11, para (a), (b)
and (c).
Value Added Tax Act (2004). Cap V1, L.F.N., s 21.
Vanguard. (2024). FG plans further VAT increase, new sharing formula. Vanguard Newspaper. Lagos: Vanguard NG.
Vasilyeva, R. I. (2023). The Impact of Fiscal Decentralization on Economic Growth of Regions of the Russian Federation. (I. V. Groshev, Ed.) Vestnik Universiteta, 1 (12), 145-153. https://doi.org/10.26425/1816-4277-2022-12-145-153
VAT (Amendment) Act (1999). No.30.
VAT (Amendment) Act (2007), No.53.
Yusuf, N. (2024). Redefining Revenue: The New Derivation Principle in VAT Distribution. The Cable, News. Lagos: Cable Media and Publishing Limited
Zee, H. H. (2008). Aspects of
Interjurisdictional Sharing of the Value-Added Tax. Public Finance Review, 36
(2), 147-168. https://doi.org/10.1177/1091142106295767
|
|
 This work is licensed under a: Creative Commons Attribution 4.0 International License
© ShodhPrabandhan 2025. All Rights Reserved.